


 134 / 352

6. PROVENANCE OF THE HP-HT UPPER ALLOCHTHON
118
RESULTS
U
–
Pb results
U
–
Pb dating results are given in Tables S1
–
S5 and
represented in Fig. 3. To allow forward comparisons,
the age spectrum has been divided into four major
groups: Palaeozoic
–
Neoproterozoic (
<
1 Ga), Mesopro-
terozoic (1.6
–
1 Ga), Paleoproterozoic (2.5
–
1.6 Ga)
and Archean (
>
2.5 Ga). Descriptions of U
–
Pb results
of each sample are as follows.
From sample GCH
–
02, 156 analyses were per-
formed, of which 118 were concordant (
<
10% discor-
dance,
d
=
24.4%,
d
: percentage of discordant
analyses). Of these, 36 are Palaeozoic
–
Neoproterozoic
(30.5%), 0 are Mesoproterozoic, 51 are Paleoprotero-
zoic (43.2%) and 31 are Archean (26.3%). MDA
02
(GCH
–
02 MDA) calculated for this sample, using 11
ages (see above), is 498.4 5.8 Ma.
From sample GCH
–
06, 142 analyses were
performed of which 126 were concordant (
<
10%
discordance,
d
=
11.3%). Of these, 28 are Palaeozoic
–
Neoproterozoic (22.2%), 0 are Mesoproterozoic, 58
are Paleoproterozoic (46%) and 40 are Archean
(31.7%). MDA
06
calculated for this sample, using
seven ages (see above), is 510.4 3.5 Ma.
From sample GCH
–
17, 134 analyses were
performed, of which 116 were concordant (
<
10%
discordance,
d
=
13.4%). Of these, 73 are Palaeozoic
–
Neoproterozoic (62.9%), 6 are Mesoproterozoic
(5.2%), 22 are Paleoproterozoic (19%) and 15 are
Archean (12.9%). MDA
17
calculated for this sample,
using 24 ages (see above), is 515.4 2.8 Ma.
From sample GCH
–
21, 161 analyses were
performed of which 139 were concordant (
<
10%
discordance,
d
=
13.7%). Of these, 22 are Palaeozoic
–
Neoproterozoic (15.8%), 2 are Mesoproterozoic
(1.4%), 69 are Paleoproterozoic (49.6%) and 46 are
Archean (33.1%). MDA
21
calculated for this sample,
using three ages (see above), is 510 28 Ma.
From sample GCH-24, 136 analyses were
performed, of which 114 were concordant (
<
10%
discordance,
d
=
16.2%). Of these, 54 are Palaeozoic
–
Neoproterozoic (47.4%), 9 are Mesoproterozoic
n
= 463
T , model age
DM
Cadomian
0
–55
–45
–35
–25
–15
–5
5
15
25
0
500
1000
1500
2000
2500
3000
ε
Hf(
t
)
crust
Eburnean crust
Archean crust
Hadean crust
(Jack Hills trend)
Depleted Mantle
CHUR
Crustal evolution trend
176
177
( Lu/ Hf = 0.0113)
BROM
500
1000
1500
2000
2500
3000
GCH-02
GCH-06
GCH-17
GCH-21
GCH-24
Cadomian crust
Eburnean crust
Archean crust
Hadean crust
500
–55
–45
–35
–25
–15
–5
5
15
25
400
500
600
700
800
900
ε
Hf(
t
)
U–Pb age (Ma)
U–Pb age (Ma)
T , model age
DM
176
177
( Lu/ Hf = 0.0113)
DM
CHUR
700
600
800
900
n
= 177
Crustal evolution trend
GCH-02
GCH-06
GCH-17
GCH-21
GCH-24
(a)
(b)
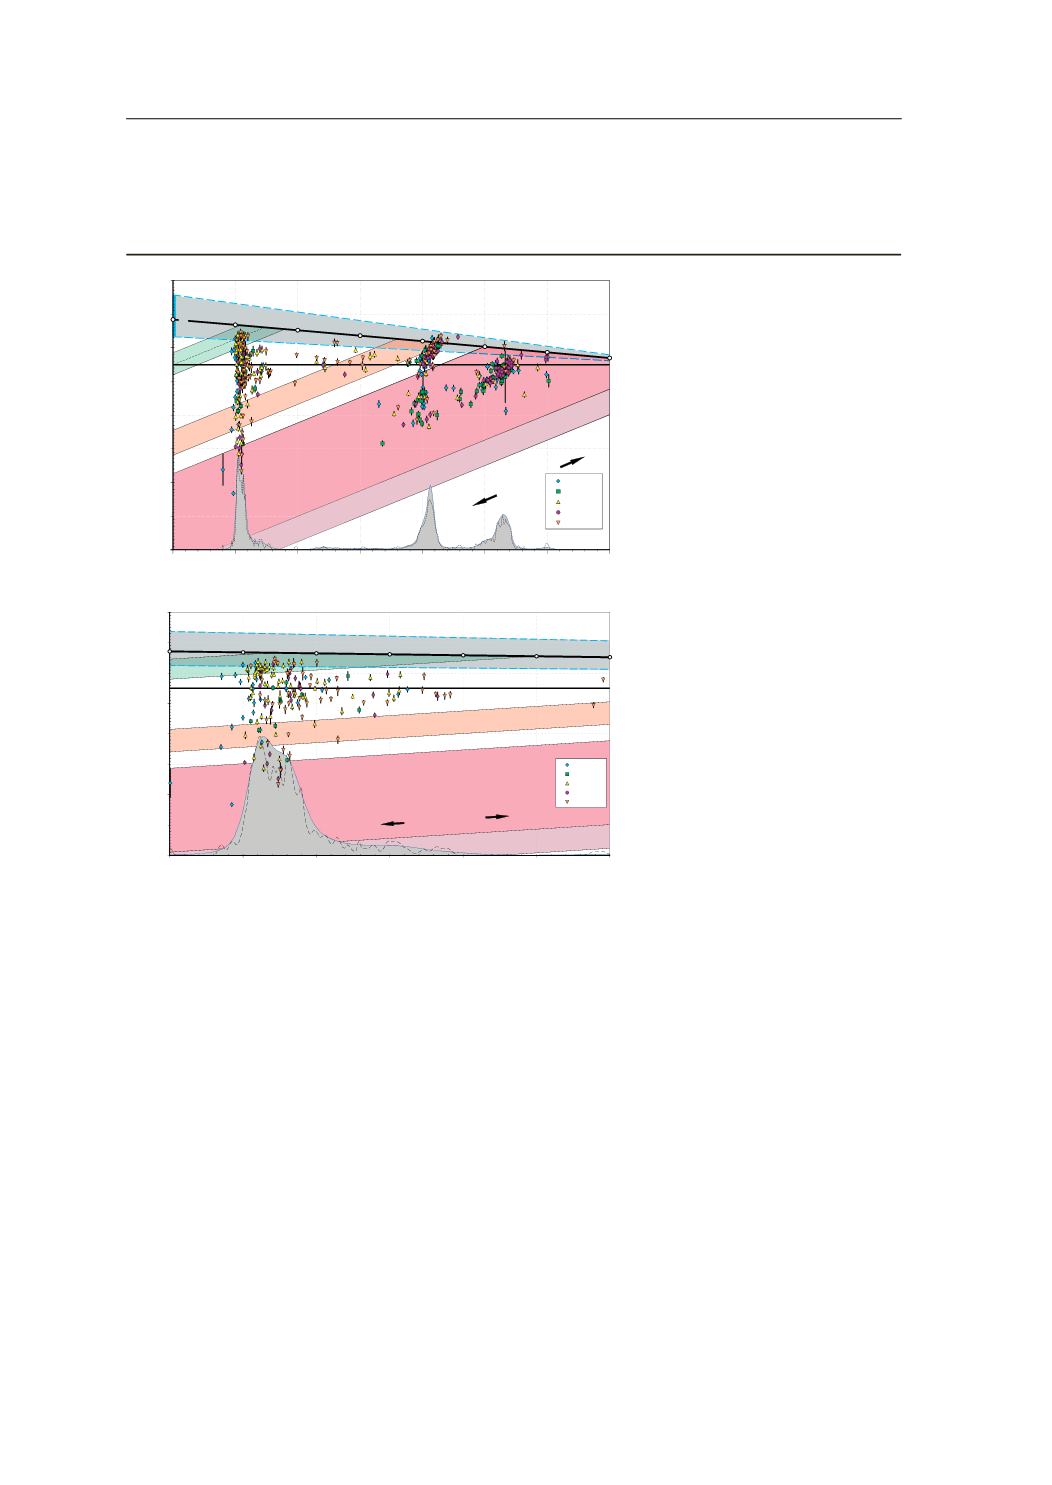
Fig. 7.
Hf isotope evolution diagram
showing Banded Gneisses combined U
–
Pb
and Lu
–
Hf zircon data. Error bars are 2
r
.
Oblique coloured bands represent crustal
evolution trends for Hadean, Archean,
Eburnean and Cadomian DM derived
rocks. Adaptive Kernel Density Estimation
of analysed zircon with Lu
–
Hf systematics
is represented in grey (a) Hf isotope
evolution diagram of all analysed zircon
grains (complete aKDEs were built with
bandwidth
=
15 Ma and histograms with
binwidth
=
25 Ma). (b) Hf isotope
evolution diagram of analysed zircon grains
in the age range of 1000
–
400 Ma (partial
aKDEs were built with bandwidth
=
15 Ma
and histograms with binwidth
=
5 Ma;
DensityPlotter5.0 software; Vermeesch,
2012). See text for discussion and for
constants and parameters used. CHUR,
chondritic uniform reservoir; DM, depleted
mantle; MORB, mid ocean ridge basalt.
©
2015 John Wiley & Sons Ltd
968
R. ALBERT
ET AL.