


 52 / 352

of Gondwana (Arenas
et al.
, 2007b). Therefore
it probably represents a domain of transitional
crust, built upon interaction between juvenile
mantle magmas and thinned Gondwanan conti-
nental crust.
Bazar Ophiolite
The Bazar Ophiolite is located in the western
part of the Órdenes Complex (Fig. 4). It consists
of a
c.
5000 m thick imbricate of tectonic slices
mainly constituted by mafic rocks and some ul-
tramafic rocks at the base (Díaz García, 1990).
The main tectonic slice (Carballo-Bazar; Sánchez
Martínez
et al.
, 2009, 2012) is
c.
4000 m thick
and includes metagabbros and amphibolites with
high-T foliation. Scarce metric-sized boudins of
mafic granoblastic granulites are preserved with-
in the mafic rocks, indicating the existence of a
previous granulite-facies metamorphic event.
These boudins are wrapped by the high-T folia-
tion and show a mineral assemblage transitional
between low and intermediate-P conditions (pla-
gioclase-clinopyroxene-orthopyroxene-horn-
blende-ilmenite±garnet±olivine). The lower part
of the main slice consists of relatively well-pre-
served gabbros and ultramafic rocks, with minor
leucogabbros and rare tonalites. The geochem-
ical features of the most representative lithol-
ogies of the Bazar Ophiolite are quite complex.
Regarding the most abundant amphibolites and
metagabbros, they show compositions equivalent
to island-arc tholeiites and N-MORB (Fig. 12e).
However, the mafic granulites seem to be tran-
sitional between MOR (mid-ocean ridge) and
WP (within-plate) basalts, with normalized trace
element similar to those of T-MORB generated
in plume-ridge interactions (Pearce, 1996) (Fig.
12e).
36
3. GEOLOGICAL FRAMEWORK
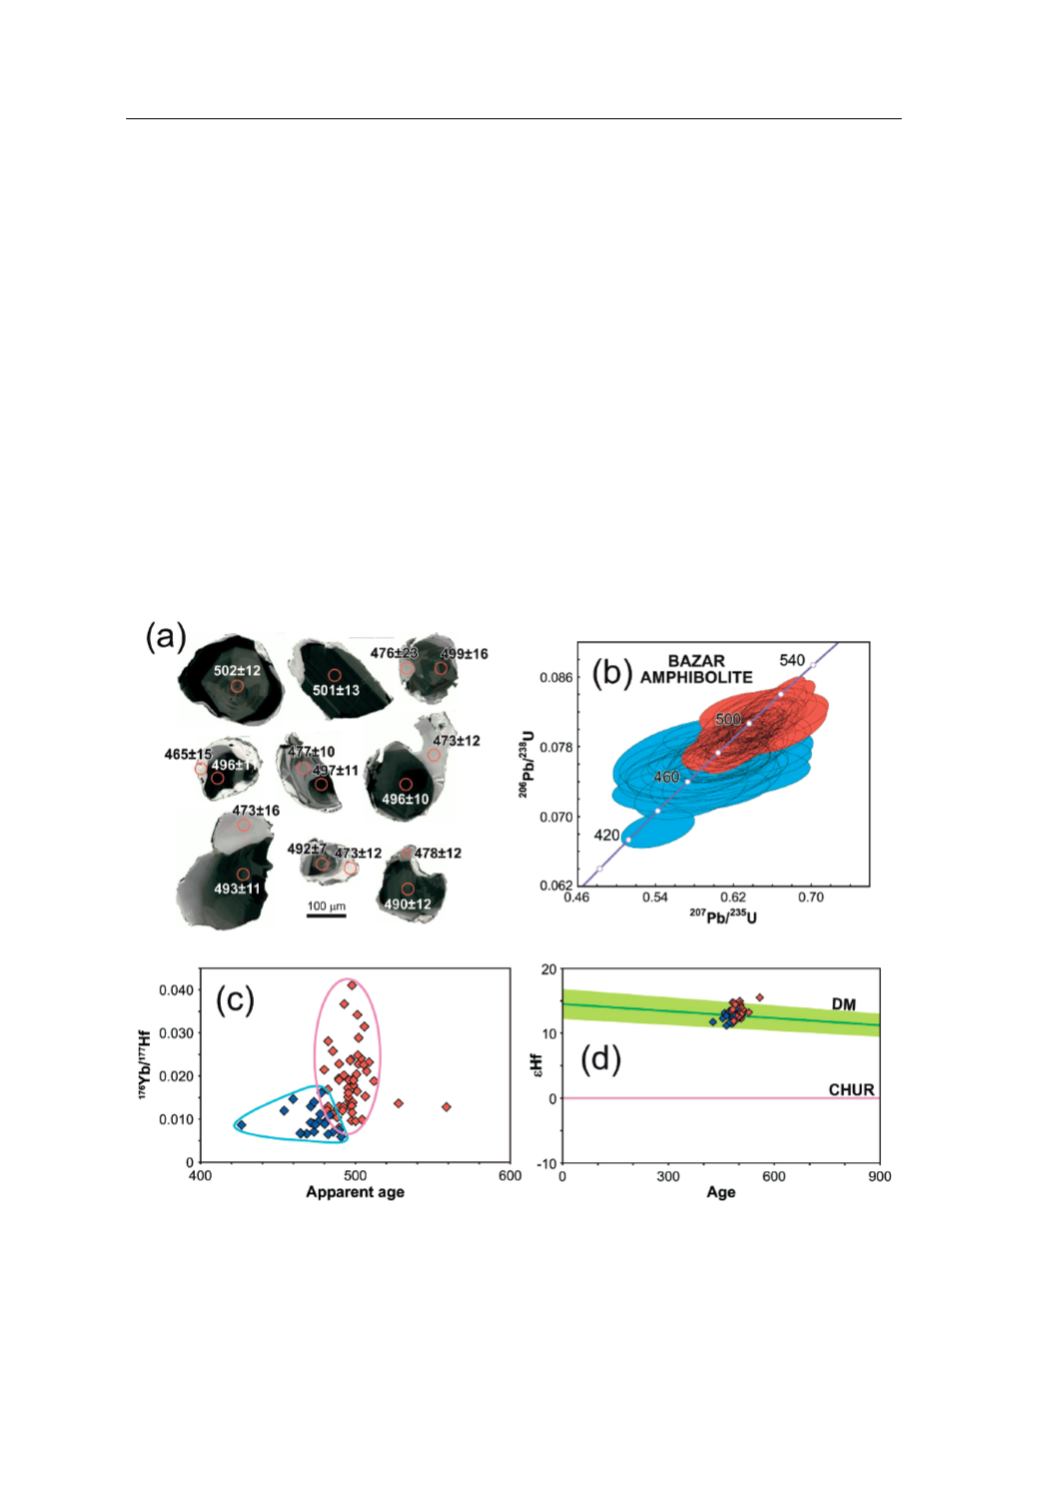
Fig. 15
. U-Pb zircon dating and Yb-Lu-Hf isotope data of a metagabbroic amphibolite sample from the Bazar Ophiolite.
(
a
) Cathodo-luminiscence images of selected zircons, circles representing the spot size of U-Th-Pb analyses. (
b
) Concordia
diagram showing the results of the U-Pb analyses, with two statistically coherent groups of data. (
c
)
176
Yb/
177
Hf versus appa-
rent age diagram, the different trends of each group of analyses are encircled. (
d
) εHf versus apparent age plot; the depleted
mantle array (DM) is extrapolated from average modern-day values of MORB (Chauvel and Blichert-Toft, 2001), assuming
a linear behaviour from
H
Hf = +2 at 4000 Ma (Vervoort and Blichert-Toft, 1999). Red symbols = zircon cores, blue symbols
= zircon overgrowths-recrystallized domains. After Sánchez Martínez
et al.
(2012).