


 131 / 352

6. PROVENANCE OF THE HP-HT UPPER ALLOCHTHON
115
showing the relative proportions of age populations
in each sample and in the combination of all samples.
A cumulative density plot is presented in Fig. 6 to
represent the relative proportions of zircon popula-
tions of each sample of the HP
–
HT upper allochthon
and of the IP Upper Allochthon.
Maximum depositional ages for each sample were
calculated following the most conservative method
(YC2
r
(3
+
)) reported by Dickinson & Gehrels
(2009), with some modifications. MDAs were calcu-
lated as the weighted mean of the youngest group
of zircon ages that can be used to calculate a con-
cordia age with Isoplots normal ‘ConcAge’ tool
(i.e. probability of data-point equivalence higher
than 0.001). The first (younger) zircon age chosen
for the group was the one that had less than 1%
age difference with the age of the following zircon.
One exception has been made to this rule. In sam-
ple GCH-02, one very young age (
c.
470 Ma) has
been ignored (because MDA for this sample was
extremely low compared with the rest of the sam-
ples), so its MDA changes from 479 11 to
497.4 5.8 Ma.
Lu
–
Hf zircon analyses
Hafnium isotope measurements (Tables S6
–
S10) were
performed with a ThermoFinnigan. Neptune multi-
collector ICP
–
MS at GUF coupled to the same laser
as described in the U
–
Pb method. Laser spots with
diameters mostly of 40
l
m were drilled with a repeti-
tion rate of 5.5 Hz and an energy density of 6 J cm
2
during 55 s of data acquisition. All data were
adjusted relative to the JMC475 ratio of
176
Hf/
177
Hf
=
0.282160 and quoted uncertainties are
quadratic additions of the within run precision of
each analysis and the reproducibility of the JMC475
(2 SD
=
0.0033%,
n
=
16). Accuracy and external
reproducibility of the method was verified by
repeated analysis of reference zircon GJ-1 and
Plesovice (Table S11) which are well within the range
of solution mode data (Woodhead & Hergt, 2005;
Gerdes & Zeh, 2006).
From the zircon cores dated with the U
–
Pb
method, a total of 463 were analysed for Lu
–
Hf
isotopes (Tables S6
–
S10). Data have been plotted
as aKDEs and PDPs in Fig. 7a,b, using Densi-
500
600
700
0.08
0.10
0.12
0.6
0.8
1.0
500
600
700
0.08
0.10
0.12
0.6
0.8
1.0
500
600
700
0.08
0.10
0.12
0.6
0.8
1.0
500
600
700
0.08
0.10
0.12
0.6
0.8
1.0
400
500
600
700
0.08
0.10
0.12
0.6
0.8
1.0
n
=36/157
σ
n
=28/142
n
=73/134
n
=22/161
n
=52/136
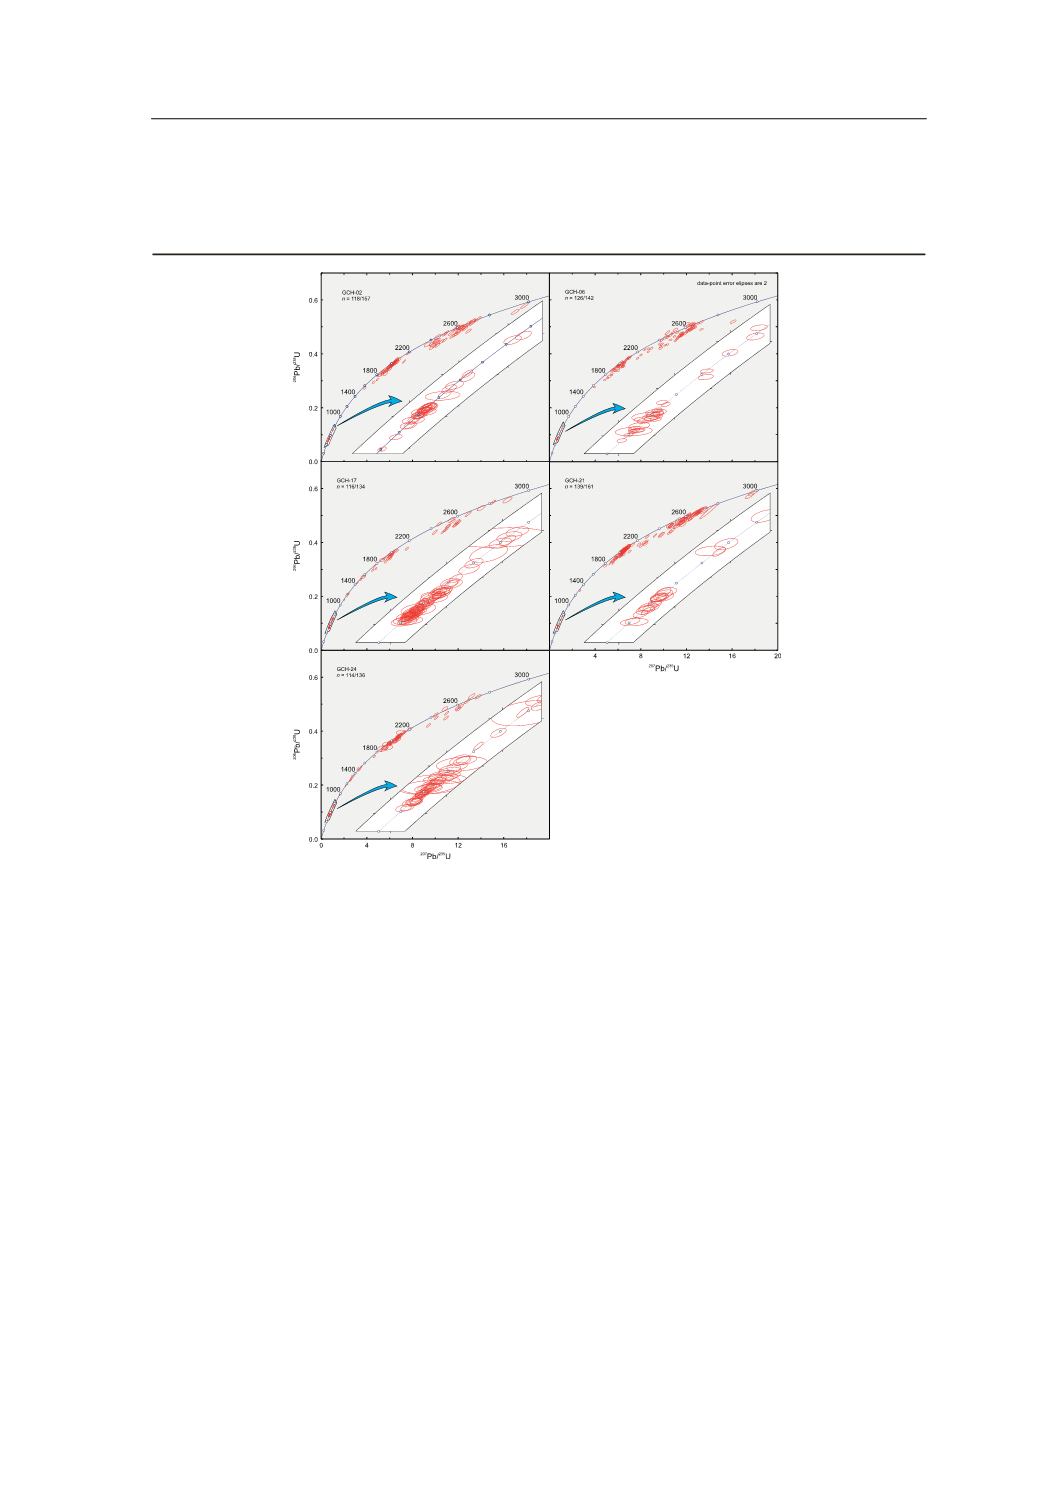
Fig. 3.
U
–
Pb conventional concordia diagrams showing
LA
–
ICP
–
MS U
–
Pb zircon analyses from samples GCH
–
02, 06, 17, 21 and 24. Ellipses represent combined 2
r
uncertainties of
206
Pb/
238
U and
207
Pb/
235
U ratios.
n
,
number of analyses considered (those with 90
–
110%
concordance)/total number of analyses.
©
2015 John Wiley & Sons Ltd
PROVENANCE OF THE HP
–
HT VARISCAN TERRANE
965