


 132 / 352

6. PROVENANCE OF THE HP-HT UPPER ALLOCHTHON
116
tyPlotter5.0 software (Vermeesch, 2012). To calcu-
late Hf epsilon units (
e
Hf
t
), the values chosen for
chondritic uniform reservoir (CHUR)
are
176
Lu/
177
Hf
=
0.0336 and
176
Hf/
177
Hf
=
0.282785
(Bouvier
et al.
, 2008), and a
176
Lu decay constant
of 1.867
9
10
11
a
1
(average of Scherer
et al.
,
2001 and S
€
oderlund
et al.
,
2004).
Initial
176
Hf/
177
Hf
(
t
)
and
e
Hf
(
t
)
for all analysed zircon
domains were calculated using the preferred U
–
Pb
ages (Figs 7a,b & 8).
500
1000
1500
2000
2500
3000
Paleoproterozoic
Meso-
proterozoic
Palaeozoic and
Neoproterozoic
Archean
GCH-24 (
n
= 114)
GCH-21 (
n
= 139)
GCH-17 (
n
= 116)
GCH-06 (
n
= 126)
GCH-02 (
n
= 118)
Total (
n
= 613)
400
500
600
700
800 (Ma)
(
n
= 52)
(
n
= 22)
(
n
= 73)
(
n
= 28)
(
n
= 36)
(
n
= 211)
10
20
30
40
50
5
10
5
10
1
4
2
3
5
5
10
15
1
2
5
10
15
20
1
4
2
3
5
6
7
5
10
1
2
3
5
10
15
1
4
2
3
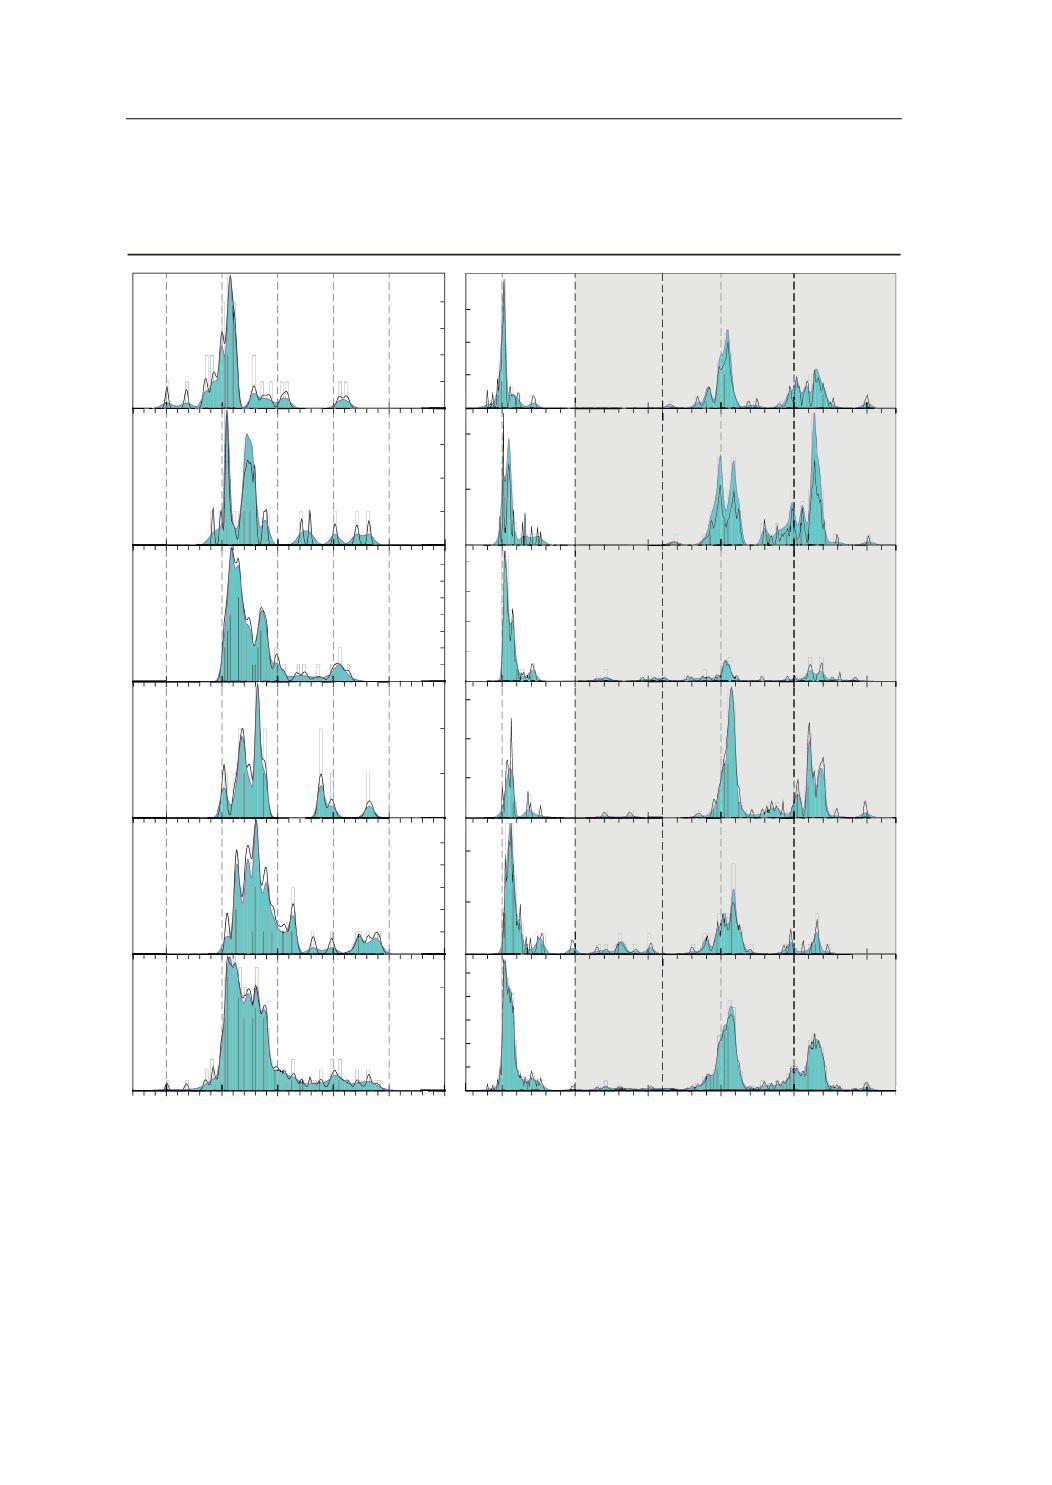
Fig. 4.
Adaptive Kernel Density Estimation plots (aKDEs, continuous line enclosing the blue area) and probability density plots
(PDPs, dashed line) for all samples and for the combination of all Banded Gneisses zircon studied for U
–
Pb isotopes. Complete
aKDEs (right) were built with bandwidth
=
15 Ma and histograms with binwidth
=
25 Ma, and partial aKDEs (left, representing
a 360
–
900 Ma time range) with bandwidth
=
5 Ma and histograms with binwidth
=
5 Ma (DensityPlotter5.0 software; Vermeesch,
2012). Numbers in the vertical axis represent histogram frequency,
n
, number of analyses.
©
2015 John Wiley & Sons Ltd
966
R. ALBERT
ET AL.