


 214 / 352

198
From the third sample studied (GCH-13,
section 7.4.3) it was concluded that the protolithic
zircon crystallised between 530 and 460 Ma, with
a crystallisation climax at
c
. 504 Ma.
From the fourth sample studied (GCH-
14, section 7.4.4) it was concluded that the
protolithic zircon crystallised at around
c
. 500
Ma. This orthogneiss forms part of the
Punta da
Moura
mingling suite and shows a zircon relative
abundance at
c
. 470 Ma. This age could be related
to a temperature input associated to the mingling
process, to a different
c
. 470 Ma metamorphic
event, or to a Pb-loss process triggered by the
Devonian HP–HT metamorphic event, which
has been dated in this sample with one zircon-
rim analysis at
c
. 390 Ma.
From the fifth sample studied (GCH-18,
section 7.4.5) it was concluded that the protolith
zircon crystallised between 524 and 492 Ma,
with a crystallisation climax at
c
. 506 Ma. Due
to the high quality of the analysis this time range
is considered as a
c
. 32 Ma cooling time of the
protolith magmas.
From the sixth sample studied (GCH-
31, section 7.4.6) it was concluded that the
protolithic zircon cores and rims were crystallised
between 520 and 470 Ma, through solid-state
recrystallisation and overgrowth processes.
From 520 to 500 Ma (with a crystallisation
climax at 512 Ma) the cores and rims grew from
a magma that was progressively mixed with
another less-juvenile liquid or from a magma
that was progressively contaminated, probably
by a continuous assimilation of the host rock. At
c
. 500 Ma the magmatic system crystallised and
from 500 to 470 Ma cores and rims were formed
by a
c
. 30 Ma long partial melting process, with
a crystallisation climax at 483 Ma. This partial
melting process was probably due to the long
lasting temperature input related to themagmatic
arc system. There is the possibility that this
process could be driven by a metamorphic event
025% '0
İ+I
W
8 3E DJH >0D@
2UWKRJQHLVVHV
'0
&+85
Q
ϱϬϬ
6HGLPHQWV
Q
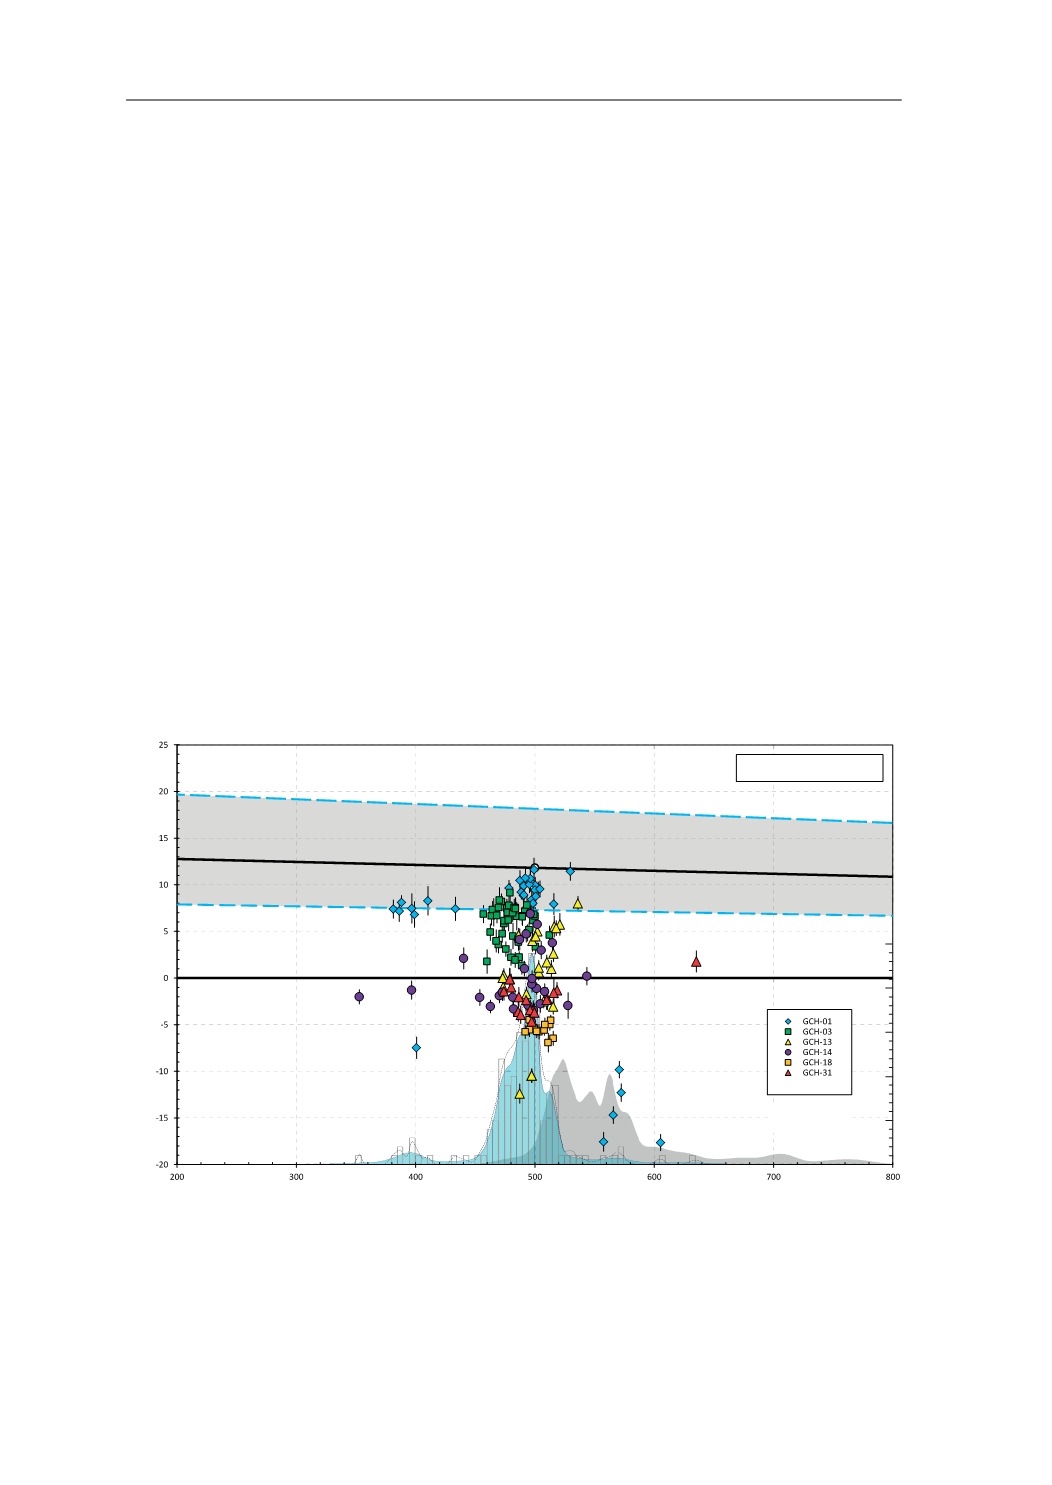
Fig. 94.
H
Hf
v
. age diagram for the six orthogneisses studied. Adaptative Kernel Density Estimation (aKDE, continuous line
enclosing the blue area, and grey area), Probability Density (PDP, black dashed line) and histogram diagrams of the U–Pb
analyses (calculated with DensityPlotter5.0, Vermeesch 2012; bandwidth = 5 Ma, binwidth = 5 Ma). Numbers in the right
vertical axis represent histogram frequency;
n
, number of analyses. The grey shaded area is the aKDE for the Eclogite Gneis-
ses detrital zircon. The histogram for the Eclogite Gneisses detrital zircon (not represented) has been normalized to the same
hight as the orthogneiss zircon histogram. Error bars are +2
σ
and -2
σ
uncertainties. MORB: mid-ocean ridge basalts; DM:
depleted mantle; CHUR: chondritic uniform reservoir.
7.5. DISCUSSION