


 211 / 352

195
7.5. Discussion
7.5.1. Leucosomes
Fromthefirstsamplestudied(GCH-25,section
7.2.1) it was concluded that the metasedimentary
rocks (in which the leucosomes are included)
underwent partial melting at high-T conditions,
triggering solid-state recrystallisation process
of the inherited zircon (Cambrian and older
zircon). When the partial melt cooled sufficiently,
overgrowths formed between 377 and 403 Ma,
with a crystallisation climax at
c.
387 Ma.
From the second sample studied (GCH-
26, section 7.2.2) it was concluded that the
overgrowths crystallised from the partial melt in
the prograde metamorphic path and that solid-
state recrystallisation occurred afterwards when
the system reached the temperature peak. The
overall age for these processes is from 379 to 403
Ma with a crystallisation climax at
c.
389 Ma.
From the third sample studied (GCH-
32, section 7.2.3) it was concluded that both
processes (recrystallisation and overgrowth)
are present within zircon crystals of the same
age (Devonian), and that the overall age for
these processes is from 358 to 408 Ma with a
crystallisation climax at
c.
394 Ma.
As all three leucosomes are formed in the same
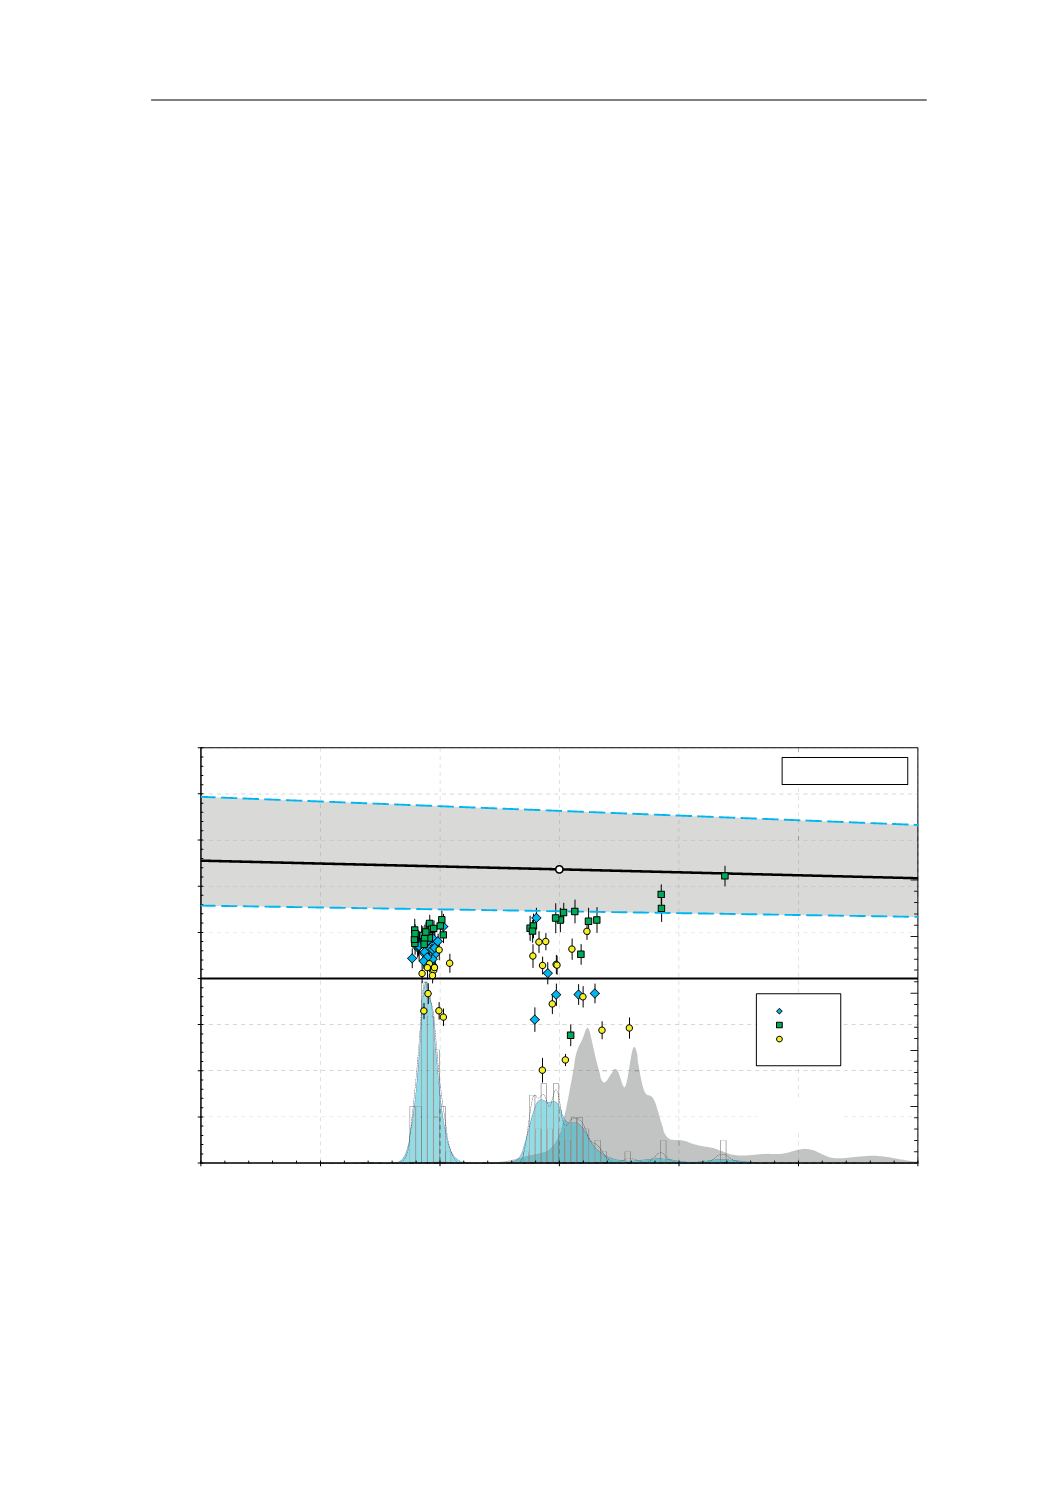
formation, Fig. 92 is presented, which combines
the
H
Hf
(t)
data of the three samples and the U–
Pb combined density diagram of these three and
of the detrital zircon of the metasedimentary
rocks. The youngest zircon population is
Devonian and it is constrained between 377 and
408 Ma, with zircon crystallisation climax at
c.
388 Ma (if the youngest and oldest ages are not
considered the time range is 379 to 403 Ma).
These ages are interpreted as to be the ages of the
migmatization event that the metasedimentary
rocks underwent. Taking into account the
conclusions for each sample, together with their
U–Pb ages it is proposed that this event triggered
ϱϬϬ
ͲϮϬ
Ͳϭϱ
ͲϭϬ
Ͳϱ
Ϭ
ϱ
ϭϬ
ϭϱ
ϮϬ
Ϯϱ
ϮϬϬ
ϯϬϬ
ϰϬϬ
ϱϬϬ
ϲϬϬ
ϳϬϬ
ϴϬϬ
025% '0
İ+I
W
8 3E DJH >0D@
/HXFRVRPHV
'0
&+85
' ,ͲϮϱ
' ,ͲϮϲ
' ,ͲϯϮ
Q
6HGLPHQWV
Q
Fig. 92.
H
Hf
v
. age diagram for the three leucosomes studied. Adaptative Kernel Density Estimation (aKDE, continuous line
enclosing the blue area, and grey area), Probability Density (PDP, black dashed line) and histogram diagrams of the U–Pb
analyses (calculated with DensityPlotter5.0, Vermeesch 2012; bandwidth = 5 Ma, binwidth = 5 Ma). Numbers in the right
vertical axis represent histogram frequency;
n
, number of analyses. The grey shaded area is the aKDE for the Eclogite Gneis-
ses detrital zircon. The histogram for the Eclogite Gneisses detrital zircon (not represented) has been normalized to the same
hight as the leucosome zircon histogram. Error bars are +2
σ
and -2
σ
uncertainties. MORB: mid-ocean ridge basalts; DM:
depleted mantle; CHUR: chondritic uniform reservoir.
7.5. DISCUSSION