


 212 / 352

196
pseudomorphic recrystallisation of the previous
zircon grains, as the metasedimentary rocks
were heated at high temperature conditions and
partially melted. Afterwards these zircon crystals
overgrew when the system cooled sufficiently.
During the study of these leucosomes, the
older zircon population (Cambrian–Ordovician)
has been assumed to be inherited from the
metasedimentary rocks. The wide range of
H
Hf
(t)
values of this leucosomes zircon population (Fig.
92) seems to favour this interpretation, because
the detrital zircon also shows a wide
H
Hf
(t)
value
range. However, the U–Pb density distribution of
the leucosomes is not included within the density
distribution of the metasedimentary rocks (Fig.
92). If the leucosome zircon population was
inherited from the metasedimentary rocks,
their U–Pb density distributions should overlap.
Moreover, the U–Pb maximum abundance peaks
of the leucosome zircon population are
c
. 485 and
c
. 495 Ma, and these ages in the metasedimentary
rocks are scarce and almost negligible. It would
appear that these observations can only be
explained by assuming that the leucosomes
were generated at around 485–495 Ma and that
they were re-melted at
c
. 388 Ma. Petrographic
observations favour this interpretation as the
quartz-feldspathic matrix is displayed as big
poikilitic crystals and as small crystals defining a
granoblastic texture. This interpretation is taken
with great care until it can be corroborated with
further studies, but it seems clear that some sort
of process must have occurred in the Cambrian–
Ordovician boundary in the light of the above-
mentioned observations.
7.5.2. Eclogites
From the first sample studied (GCH-19,
section 7.3.1) it was concluded that a
c
. 387 Ma
high-grade metamorphic event induced solid-
state zircon pseudomorphic recrystallisations,
triggering U–Pb age rejuvenation via Pb-loss
processes of the zircons that crystallised in the
ϱϬϬ
025% '0
İ+I
W
8 3E DJH >0D@
(FORJLWHV
'0
&+85
6HGLPHQWV
Q
Q
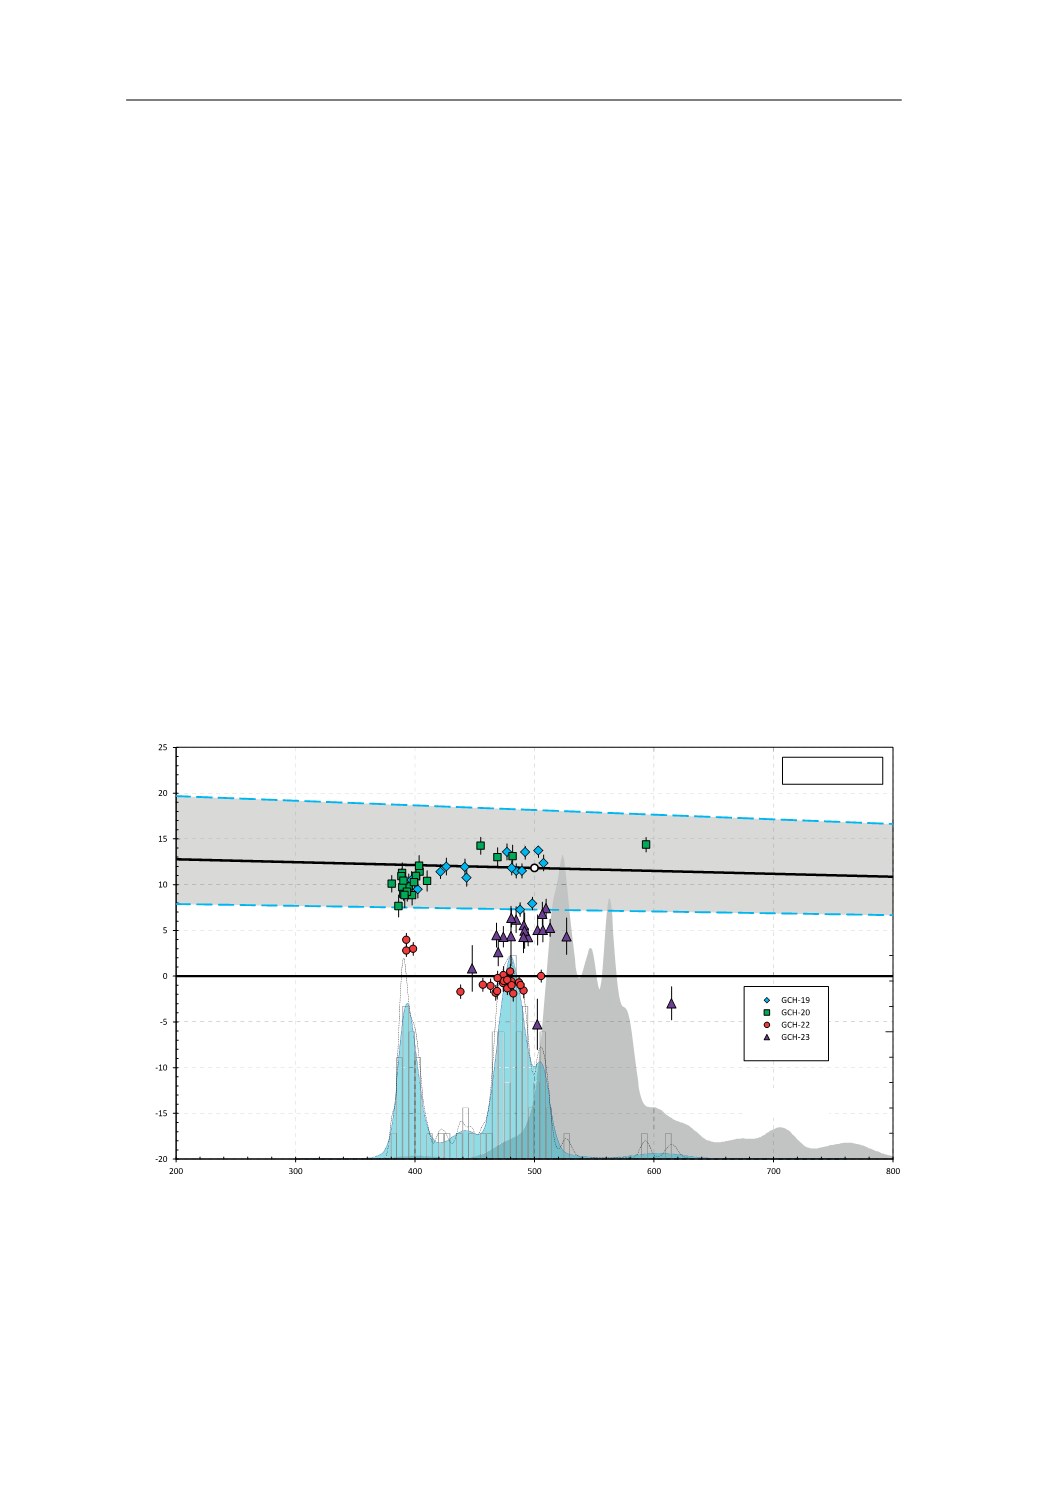
Fig. 93.
H
Hf
v
. age diagram for the four eclogites studied. Adaptative Kernel Density Estimation (aKDE, continuous line
enclosing the blue area, and grey area), Probability Density (PDP, black dashed line) and histogram diagrams of the U–Pb
analyses (calculated with DensityPlotter5.0, Vermeesch 2012; bandwidth = 5 Ma, binwidth = 5 Ma). Numbers in the right
vertical axis represent histogram frequency;
n
, number of analyses. The grey shaded area is the aKDE for the Eclogite Gneis-
ses detrital zircon. The histogram for the Eclogite Gneisses detrital zircon (not represented) has been normalized to the
same hight as the eclogite zircon histogram. Error bars are +2
σ
and -2
σ
uncertainties. MORB: mid-ocean ridge basalts; DM:
depleted mantle; CHUR: chondritic uniform reservoir.
7.5. DISCUSSION