


 231 / 352

formationhas not. Both formationswere probably
deposited in the same back-arc basin at
c.
521–
506 Ma. The first sediments deposited were those
of the Banded Gneiss formation (due to its higher
isotopic heterogeneity and higher presence of
intruded igneous rocks), formed by the mixture
of the old components from the WAC (Eburnean
and Archean detritus) and abundant arc-related
c.
590–520 Ma sediments. The Cariño Gneisses
protoliths deposited afterwards, filling the same
basin with WAC sediments and abundant
c.
560–
510 Ma arc-derived sediments.
When the sediments of these formations were
deposited, igneous rocks intruded in the Banded
Gneiss formation. The first igneous materials to
intrude were the acid magmas, the protoliths of
the orthogneisses, at
c.
512 Ma, and afterwards
the basic magmas at
c.
505 Ma (Fig. 2). Some of
the basic magmas are clearly juvenile additions
to the crust derived by partial melting of a
depleted mantle source. Others, however, have
more enriched isotope signatures, which are
interpreted as a partial fusion of an enriched
mantle component (probably the subcontinental
mantle of Gondwana), or as an important
contamination of a DM-derived partial melt
with continental crust material. The sources of
the acid magmas probably divers from depleted
to isotopically enriched sources. The intrusive
processes continued in the magmatic arc, and
at
c.
498 Ma the orthogneisses show their zircon
crystallisation climax. At this time the arc activity
induced high-T related metamorphism that
partially melted previously generated igneous
rocks (generating acid rocks by partially melting
basic rocks) until
c.
460–470 Ma. Due to this high
temperature input the sediments partially melted,
migmatising at
c.
495–485 Ma (Fig. 2). The basic
rock´s zircon crystallisation climax occurred at
215
9. FINAL DISCUSSION AND CONCLUSIONS
Ͳϱϱ
Ͳϰϱ
Ͳϯϱ
ͲϮϱ
Ͳϭϱ
Ͳϱ
ϱ
ϭϱ
Ϯϱ
ϯϬϬ
ϯϱϬ
ϰϬϬ
ϰϱϬ
ϱϬϬ
ϱϱϬ
ϲϬϬ
ϲϱϬ
ϳϬϬ
ϳϱϬ
ϴϬϬ
^ĞĚŝŵĞŶƚƐ ; ĂƌŝŹŽ н ĂŶĚĞĚͿ н ŽƌƚŚŽŐŶĞŝƐƐĞƐ н ĞĐůŽŐŝƚĞƐ н ůĞƵĐŽƐŽŵĞƐ
^ĞĚŝŵĞŶƚƐ ;
Ŷ
с ϯϮϭͿ
KƌƚŚŽŐŶĞŝƐƐĞƐ ;
Ŷ
с ϭϱϳͿ
ĐůŽŐŝƚĞƐ ;
Ŷ
с ϳϲͿ
>ĞƵĐŽƐŽŵĞƐ ;
Ŷ
с ϭϬϲͿ
İ+I
W
8 3E DJH >0D@
&DGRPLDQ FUXVW
(EXUQHDQ FUXVW
$UFKHDQ FUXVW
+DGHDQ FUXVW
ϱϬϬ
7 PRGHO DJH
'0
&UXVWDO HYROXWLRQ WUHQG
/X +I
'0
&+85
ϳϬϬ
ϲϬϬ
ϰϬϬ
025% '0
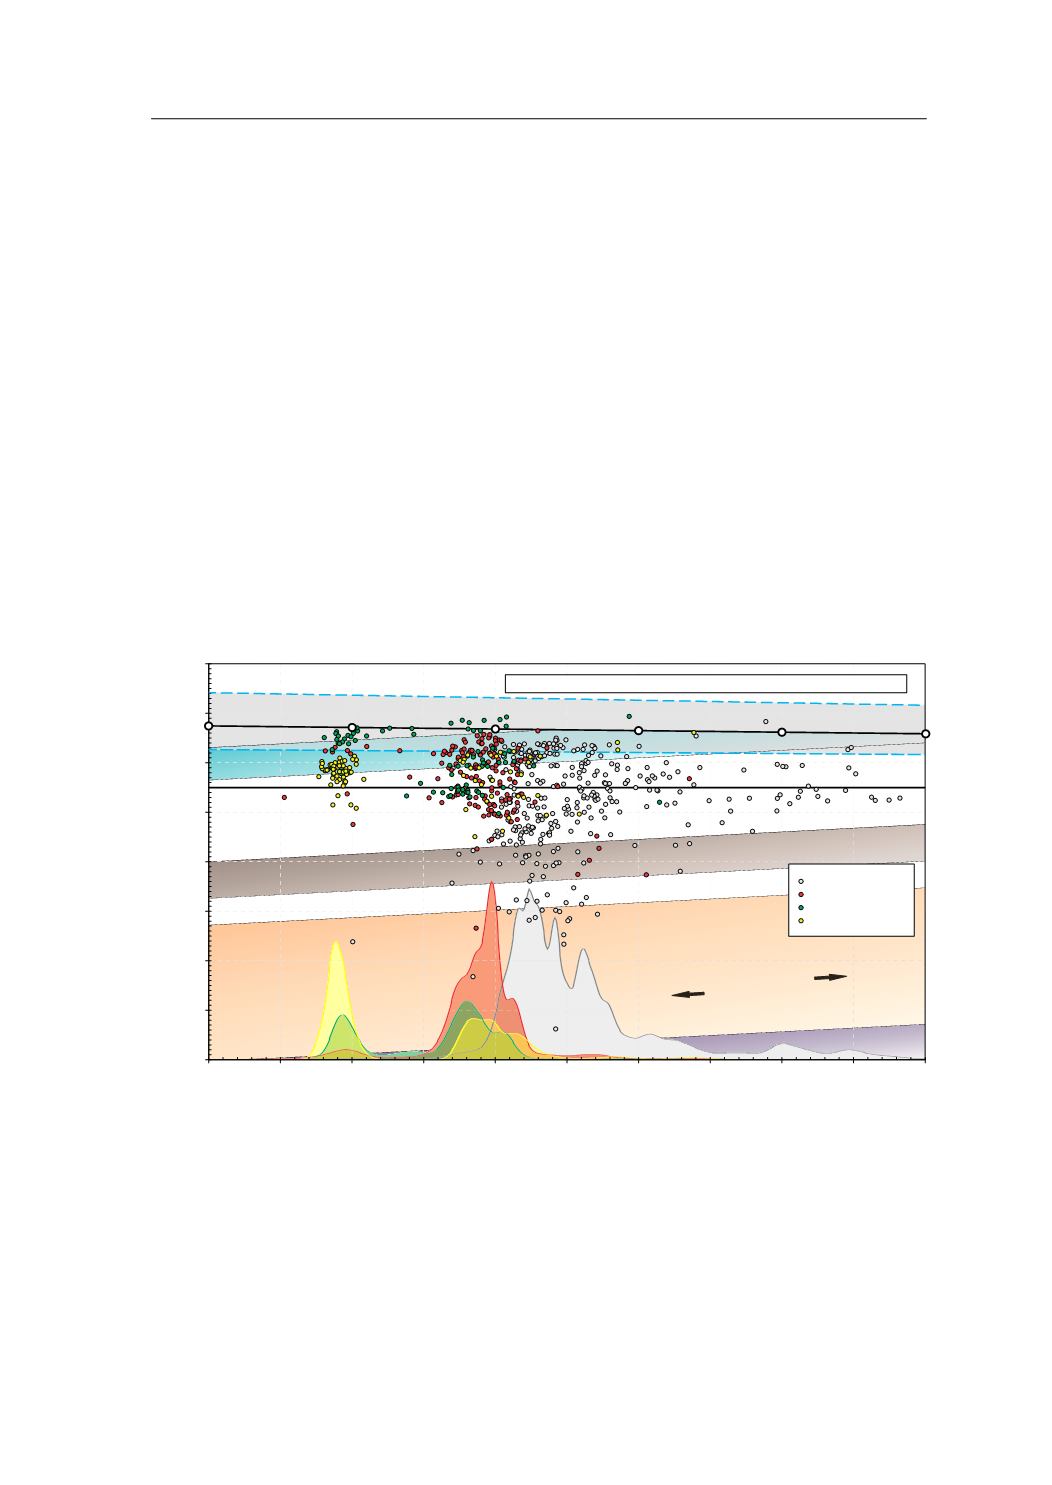
Fig. 2.
H
Hf
v
. age diagram for all the lithologies studied. Density plots at the base of the figure are adaptative Kernel Density
Estimations (aKDEs) for each of the lithologies studied (grey: sediments; red: orthogneisses; green: eclogites; yellow:
leucosomes). The four aKDEs have been normalized to the same histogram bin heights (histogram diagrams of the U–Pb
analyses that have their corresponding Lu–Hf analysis represented in this figure. Histogram diagrams are not represented,
and have been calculated with DensityPlotter5.0, Vermeesch 2012; bandwidth = 5 Ma, binwidth = 5 Ma). Coloured inclined
shaded areas represent crustal evolution trends for Hadean, Archean, Eburnean and Cadomian DM derived rocks. MORB
H
Hf interval was taken from the Atlantic, Pacific and Indian MORB values (excepting three unusual low values from the
Indian Ocean) reported by Chauvel & Blichert-Toft (2001) considering a minimum
H
Hf
(t=0Ma)
= +8.3 (
176
Hf/
177
Hf = 0.28302)
and a maximum
H
Hf
(t=0Ma)
= +20.7 (
176
Hf/
177
Hf = 0.28337). These values are propagated to
H
Hf
(t=4Ga)
= 0 defining a grey field
(enclosed by the blue discontinuous lines) around the DM-evolution trend, to provide an indication of the likely range of
DM compositions through time.
n
, number of concordant zircon analyses (90–100% conc.), analysed for Lu–Hf isotopes.
MORB: mid-ocean ridge basalts; DM: depleted mantle; CHUR: chondritic uniform reservoir.