


 150 / 352

134
short axis (Fig. 5).
Domain II
H
Hf
(t)
values are high, with values
between
c.
+1.9 and +5.6 (average: +3.5; Fig. 6a).
Domain I
H
Hf
(t)
values are lower than those of
domain II, with values from -4.4 to +0.6 (average:
-1.8; Fig. 6a).
176
Hf/
177
Hf
(t)
ratios for domain II
zircon plot around 0.282639 ± 0.000048 (±2 SD;
Fig. 6b), and
176
Hf/
177
Hf
(t)
ratios for domain I
zircon are lower than those of domain II and plot
at 0.282414 ± 0.000088 (±2 SD; Fig. 6b).
U content of domain II analysed zircon is very
low, in the range of 15–515 ppm (average: 133
ppm). U content of domain I analysed zircon is
also low, in the range of 112–421 ppm (average:
229 ppm; Appx. 4).Domain II Th/U ratios are
always below 0.2, and vary from
c
. 0.002 to
c.
0.065 (average: 0.008); and domain I Th/U ratios
are higher and more variable, and vary from
c.
0.09 to
c.
0.96 (average: 0.56; Fig. 7a).
176
Lu/
177
Hf ratios of domain II zircon are
extremely low and vary from
c.
0.00003 to
c.
0.00041 (average: 0.00008; Fig. 7b).
176
Lu/
177
Hf
ratios of domain I zircon are higher than those
of domain II and vary from
c.
0.00134 to
c.
0.00185 (average: 0.00158; Fig. 7b).
176
Yb/
177
Hf
ratios of domain II zircon are extremely low and
vary from
c.
0.0009 to
c.
0.0126 (average: 0.0025;
Appx. 4).
176
Yb/
177
Hf ratios of domain I zircon are
higher than those of domain II and vary from
c.
0.0401 to
c.
0.0557 (average: 0.0474; Appx. 4).
Nd whole-rock model-age is 1.24 Ga and
H
Nd
(t)
values are:
H
Nd
(t=0)
= -1.3;
H
Nd
(t=387)
= +0.7.
7.2.1.2. Discussion
U–Pbagescanbesub-dividedintothreegroups,
the old inheritances, the Cambrian domain I
zircon and the Devonian domain II zircon. The
younger population in this sample, domain II,
has the highest
176
Hf/
177
Hf
(t)
ratios, clearly higher
than domain I zircon (Fig. 6b). This necessarily
implies that domain II zircon are overgrowths,
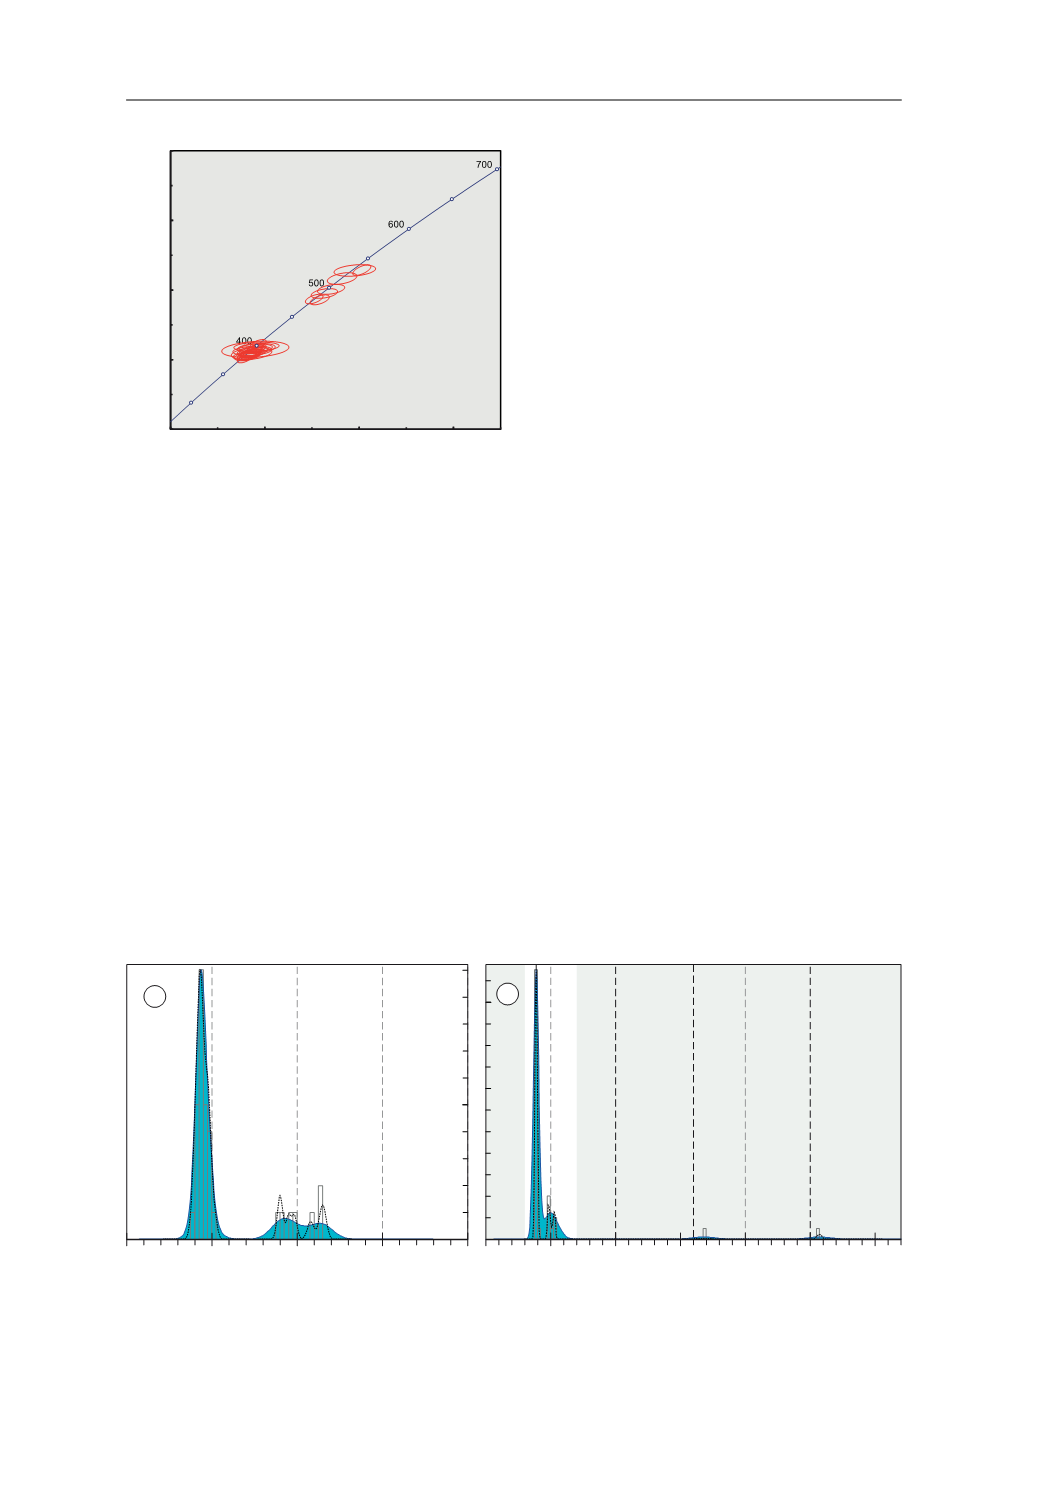
Fig. 3.
U-Pb conventional concordia diagram showing U-Pb
zircon analyses of the studied sample. Ellipses represent
combined 2
σ
uncertainties of
206
Pb/
238
U and
207
Pb/
235
U
ratios.
n
, number of analyses considered (those with 90–
110% concordance)/total number of U–Pb analyses.
3E 8
GDWD SRLQW HUURU HOLSVHV DUH ı
3E 8
*&+
/HXFRVRPH
Q
Fig. 4.
Adaptative Kernel Density Estimation (aKDE, continuous line enclosing the blue area), Probability Density (PDP,
black dashed line) and histogram diagrams of the U–Pb analyses (calculated with DensityPlotter5.0, Vermeesch 2012).
Numbers in the vertical axis represent histogram frequency;
n
, number of analyses.
a
Partial plot representing data within
a 300–700 Ma time range (bandwidth = 5 Ma, binwidth = 5 Ma).
b
Complete plot (bandwidth = 15 Ma, binwidth = 25 Ma).
3DOHRSURWHUR]RLF
0HVR
SURWHUR]RLF
3DOHR]RLF DQG
1HRSURWHUR]RLF
$UFKHDQ
>0D@
Q
Q
D
E
7.2. LEUCOSOMES