


 155 / 352

139
zircon plot around 0.282679 ± 0.000037 (±2 SD;
Fig. 13b), and
176
Hf/
177
Hf
(t)
ratios for domain I
zircon plot at 0.282609 ± 0.000214 (±2 SD; Fig.
13b). If the two lower ratios are not considered,
domain I ratios are in the range of 0.282650 ±
0.000036 (±2 SD; Fig. 13b).
Domain II Th/U ratios are always below
0.2, and vary from
c.
0.004 to
c.
0.033 (average:
0.011); and domain I Th/U ratios are higher
(higher than 0.2) and more variable, from
c.
0.40
to
c.
0.92 (average: 0.58; Fig. 14a). U content of
domain II analysed zircon is highly variable, in
the range of 20–2074 ppm (average: 223 ppm). U
content of domain I analysed zircon is variable,
but not as much as domain II, in the range of
76–885 ppm (average: 403 ppm; Appx. 4).
176
Lu/
177
Hf ratios of domain II zircon are low
and vary from
c.
0.00013 to
c.
0.00066 (average:
0.00035; Fig. 14b).
176
Lu/
177
Hf ratios of domain
I zircon are higher than those of domain II and
vary from
c.
0.00080 to
c.
0.00230 (average:
0.00154; Fig. 14b).
176
Yb/
177
Hf ratios of domain
II zircon are low and vary from
c.
0.0028 to
c.
0.0206 (average: 0.0098; Appx. 4).
176
Yb/
177
Hf
ratios of domain I zircon are higher than those
of domain II and vary from
c.
0.0217 to
c.
0.0657
(average: 0.0447; Appx. 4).
Nd whole-rock model-age is 0.92 Ga and
H
Nd
(t)
values are:
H
Nd
(t=0)
= -1.6;
H
Nd
(t=389)
= +1.6.
7.2.2.2. Discussion
U–Pb ages can be sub-divided into three
groups, the old inheritances, Cambrian–
Ordovician domain I zircon and Devonian
domain II zircon. The younger population in this
sample, domain II, has similar
176
Hf/
177
Hf
(t)
ratios
within error than domain I zircon (Fig. 13b).
These observations suggest that domain II zircon
is a consequence of solid-state recrystallisation
of domain I zircon. As explained in the previous
sample (leucosome GCH-25), zircon domains
altered by pseudomorphic recrystallisation
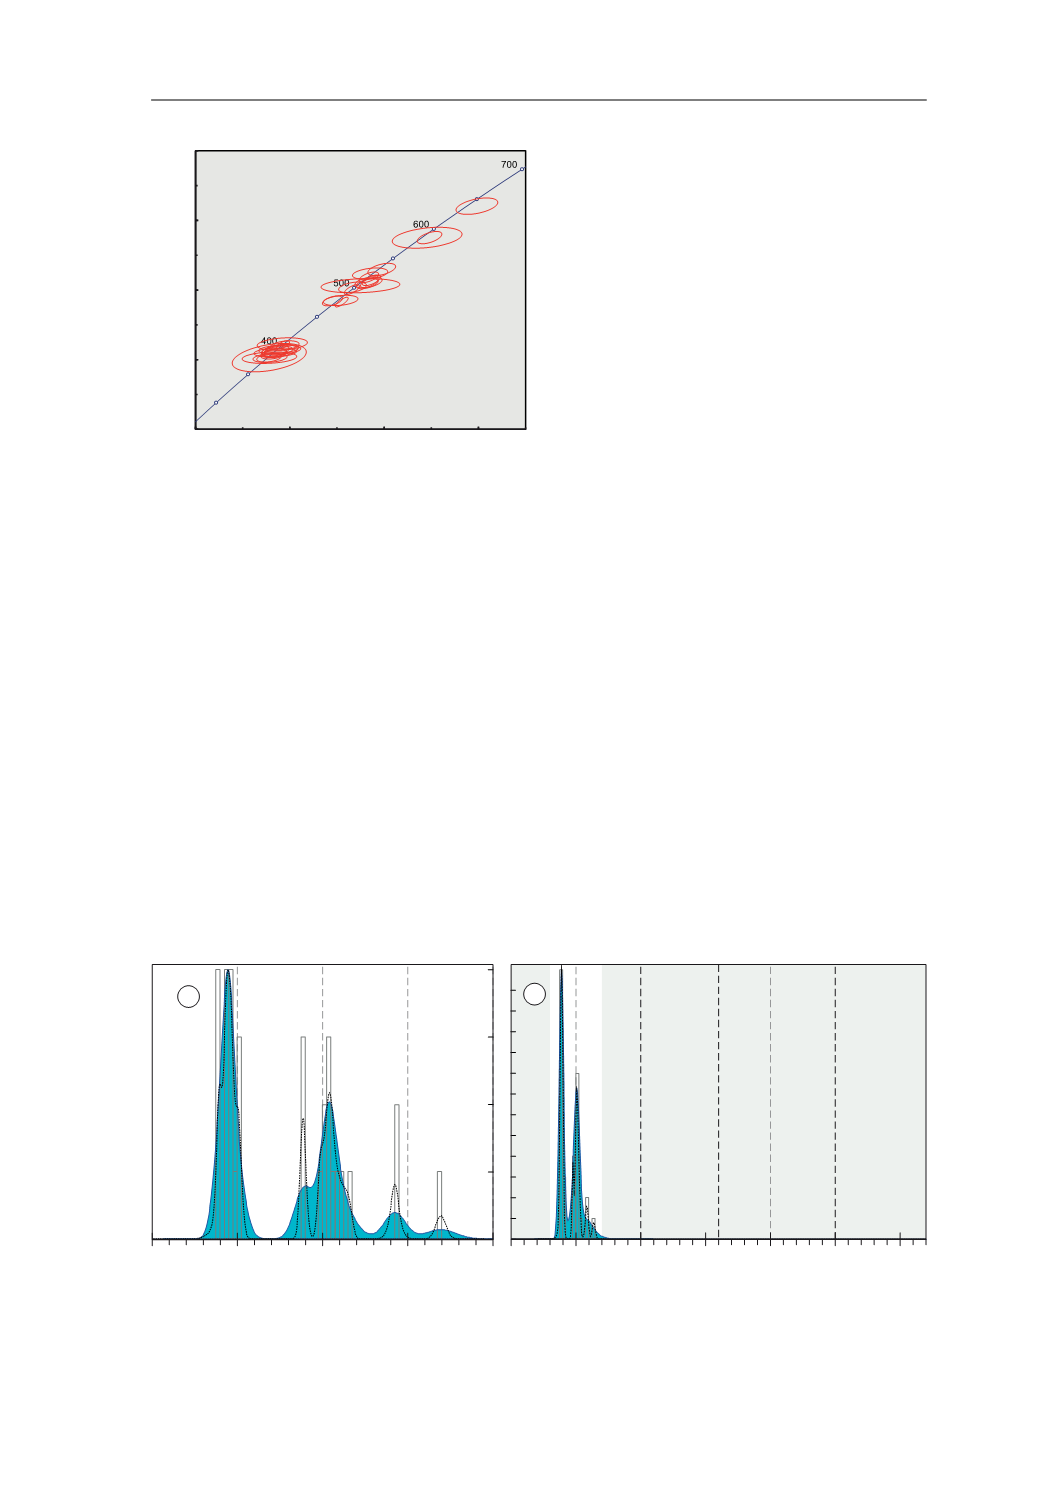
Fig. 10.
U-Pb conventional concordia diagram showing
U-Pb zircon analyses of the studied sample. Ellipses repre-
sent combined 2
σ
uncertainties of
206
Pb/
238
U and
207
Pb/
235
U
ratios.
n
, number of analyses considered (those with 90–
110% concordance)/total number of U–Pb analyses.
3E 8
GDWD SRLQW HUURU HOLSVHV DUH ı
3E 8
*&+
/HXFRVRPH
Q
Fig. 11.
Adaptative Kernel Density Estimation (aKDE, continuous line enclosing the blue area), Probability Density (PDP,
black dashed line) and histogram diagrams of the U–Pb analyses (calculated with DensityPlotter5.0, Vermeesch 2012).
Numbers in the vertical axis represent histogram frequency;
n
, number of analyses.
a
Partial plot representing data within
a 300–700 Ma time range (bandwidth = 5 Ma, binwidth = 5 Ma).
b
Complete plot (bandwidth = 15 Ma, binwidth = 25 Ma).
3DOHRSURWHUR]RLF
0HVR
SURWHUR]RLF
3DOHR]RLF DQG
1HRSURWHUR]RLF
$UFKHDQ
>0D@
Q
Q
D
E
7.2. LEUCOSOMES