


 151 / 352

135
from a fluid phase with higher
176
Hf/
177
Hf
(t)
ratios
than the fluid from which the cores crystallised,
and that they are not a consequence of solid-
state recrystallisation of domain I zircon. This
is because Hf
4+
substitutes the cationic position
of Zr
4+
in the Zrn structure and because Hf has
almost identical chemical properties, including
atomic radii, than Zr. Therefore Hf will almost
never be purged from the Zrn crystalline
structure during a solid-state recrystallisation
process (Hoskin & Schaltegger, 2003; Gerdes &
Zeh, 2009). So a solid-state recrystallisation of
domain I to form domain II zircon is discarded.
Furthermore, the higher
176
Hf/
177
Hf
(t)
ratios of
domain II overgrowths imply that the fluid phase
from which this zircon grew from was enriched
in radiogenic
176
Hf. This
176
Hf comes from
176
Lu
decay. As the amount of
176
Lu in zircon is very
low and the
176
Lu decay is very slow (
176
Lu half-
life:
c.
37.8 Ga), it is very unlikely that the higher
amounts of radiogenic domain II
176
Hf come
from the decay of zircon
176
Lu. So, the higher
domain II
176
Hf/
177
Hf
(t)
ratios must be a result of
incorporating radiogenic
176
Hf into the partial
melt. This
176
Hf should come from the decay of
176
Lu liberated from the melted minerals that
formed the leucosome. This process is capable of
liberating sufficient radiogenic
176
Hf to explain
domain II
176
Hf/
177
Hf
(t)
ratios (
cf.
with Gerdes
& Zeh, 2009; Zeh
et al.
, 2010 and references
therein). Domain II has a combined well-defined
oscillatory and multi-faceted (“soccerball”)
textures as shown from the CL images (Fig.
5). These textures favour the interpretation of
overgrowth development of domain II zircon.
Moreover, the multi-faceted textures point to a
high-T overgrowth environment for these rims,
as these textures have been related to high-T
terrains (Harley
et al.
, 2007). From field and
petrographic observations this rock has been
interpreted as a leucosome formed by partial
melting of the BandedGneissesmetasedimentary
$
ڙ
$
ڙ
$
ڙ
$
ڙ
$
1R GDWD
ڙ
$
ڙ
$
ڙ
$
ڙ
$
ڙ
$
ڙ
ȝP
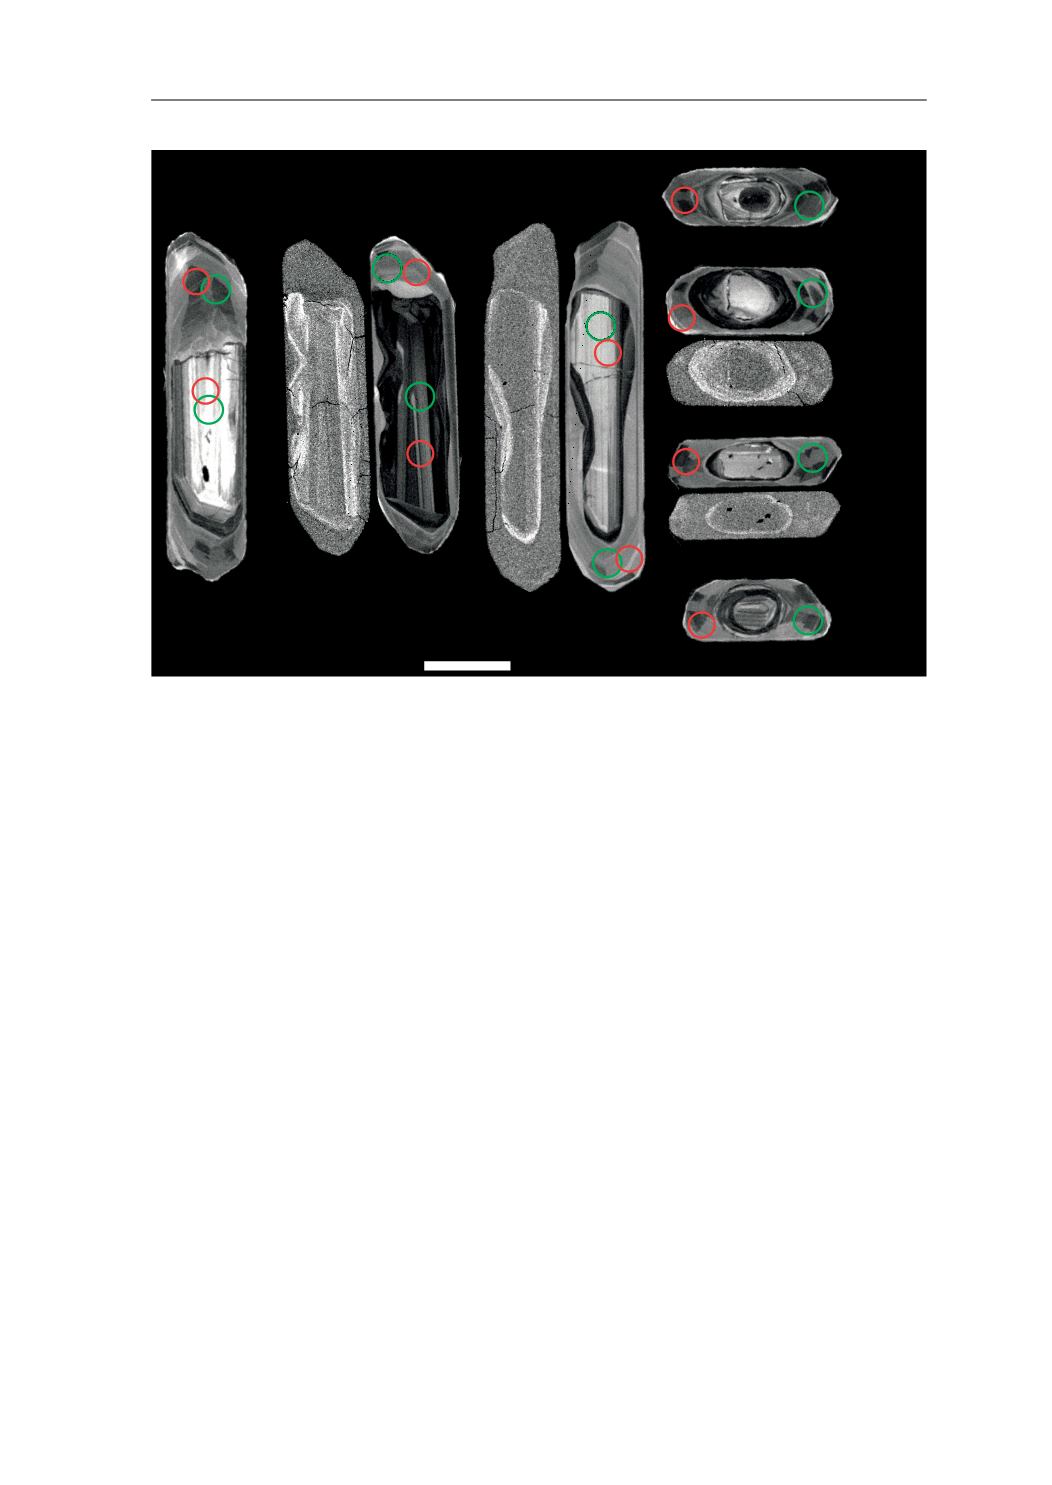
Fig. 5.
BSE and CL images of representative zircons from the studied sample. Images without circles are BSE (back-scattered
electrons) images, and those with circles are CL (cathodoluminescence) images. Laser ablation pits for U–Pb analyses (red
line circles) have 30
μ
m diameters. Laser ablation pits for Lu–Hf analyses (green line circles) have 33
μ
m diameters. White
numbers are the reference number of the analysis, red numbers are the U–Pb age and its 2
σ
error (Ma) and the green
numbers are the
H
Hf values for the U–Pb age. U–Pb analysis of A133 gave a discordant age, and
H
Hf value was calculated
for an assumed 500 Ma age.
7.2. LEUCOSOMES