


 154 / 352

138
7.2.2. Sample GCH-26
(
Figueiroa leucosome)
This samplewas collected from
Figueiroa
beach
(43°42’40.50”N, 7°51’48.51”W), at the 185–190
m point of the
Figueiroa
beach geological section
(chapter 4).
This sample is interpreted from field
observations as a leucosome, formed by partial
melting of the BandedGneissesmetasedimentary
rocks (Fig. 8). This lithology is displayed as
centimetre sized pods (“
augens
”), folded and
coherent with the metasedimentary rocks
regional foliation (Ref: 114089).
From microscopic observations this sample
has a granoblastic texture and has Qz, Afs and
Pl as major constituents (Fig. 9). These minerals
are poikilitic and feldspar is usually altered and
shows pertitic exsolutions. Qz contains minor
inclusions of Ap and feldspar contains inclusions
of Qz, Bt, Ap and Zrn. Minor constituents are
Ap, Bt, white mica, Amp, Rt, and Zrn.
7.2.2.1. Results
From sample GCH-26, 50 U–Pb analyses were
performed of which 32 were concordant (
d
=
36%; Figs. 10 & 11a,b). Domain II is defined by
16 Devonian analyses constrained between 379
and 403 Ma, and show a well-defined maximum
abundance at 389 Ma. Domain I is defined by
12 Cambrian–Ordovician analyses that show
a well-defined maximum abundance at 508
Ma, and a relative abundance peak at 477 Ma.
Three analyses are Neoproterozoic, which are
considered inheritances (Fig. 11b).
Most of the domain I zircon (Cambrian–
Ordovician) show more or less well defined
oscillatory zonings, others show patchy-chaotic
textures. They are normally surrounded by
lobulated sinuous rims, which are dark and also
bright in CL images and bright in BSE images.
Domain II (Devonian) zircon is displayed as
rims surrounding domain I zircon. Their show
well defined combined oscillatory and multi-
faceted (“soccerball”) textures. In some zircon
grains these textures are badly defined and even
structure-less. These rims are the outer features
observed and define the crystals external habit,
which normally shows well defined crystal faces
and the long crystal axis to be between two and
four times longer than the short axis (Fig. 12).
Domain II
H
Hf
(t)
values are high, with values
between
c.
+3.7 and +6.3 (average: +4.9; Fig.
13a). Domain I
H
Hf
(t)
values are variable, with
values of -6.2 to +7.5 (average: +5.0; Fig. 13a). If
the two lower values are not considered, domain
I values are in the range of +5.1 to +7.5 (average:
+6.4; Fig. 13a).
176
Hf/
177
Hf
(t)
ratios for domain II
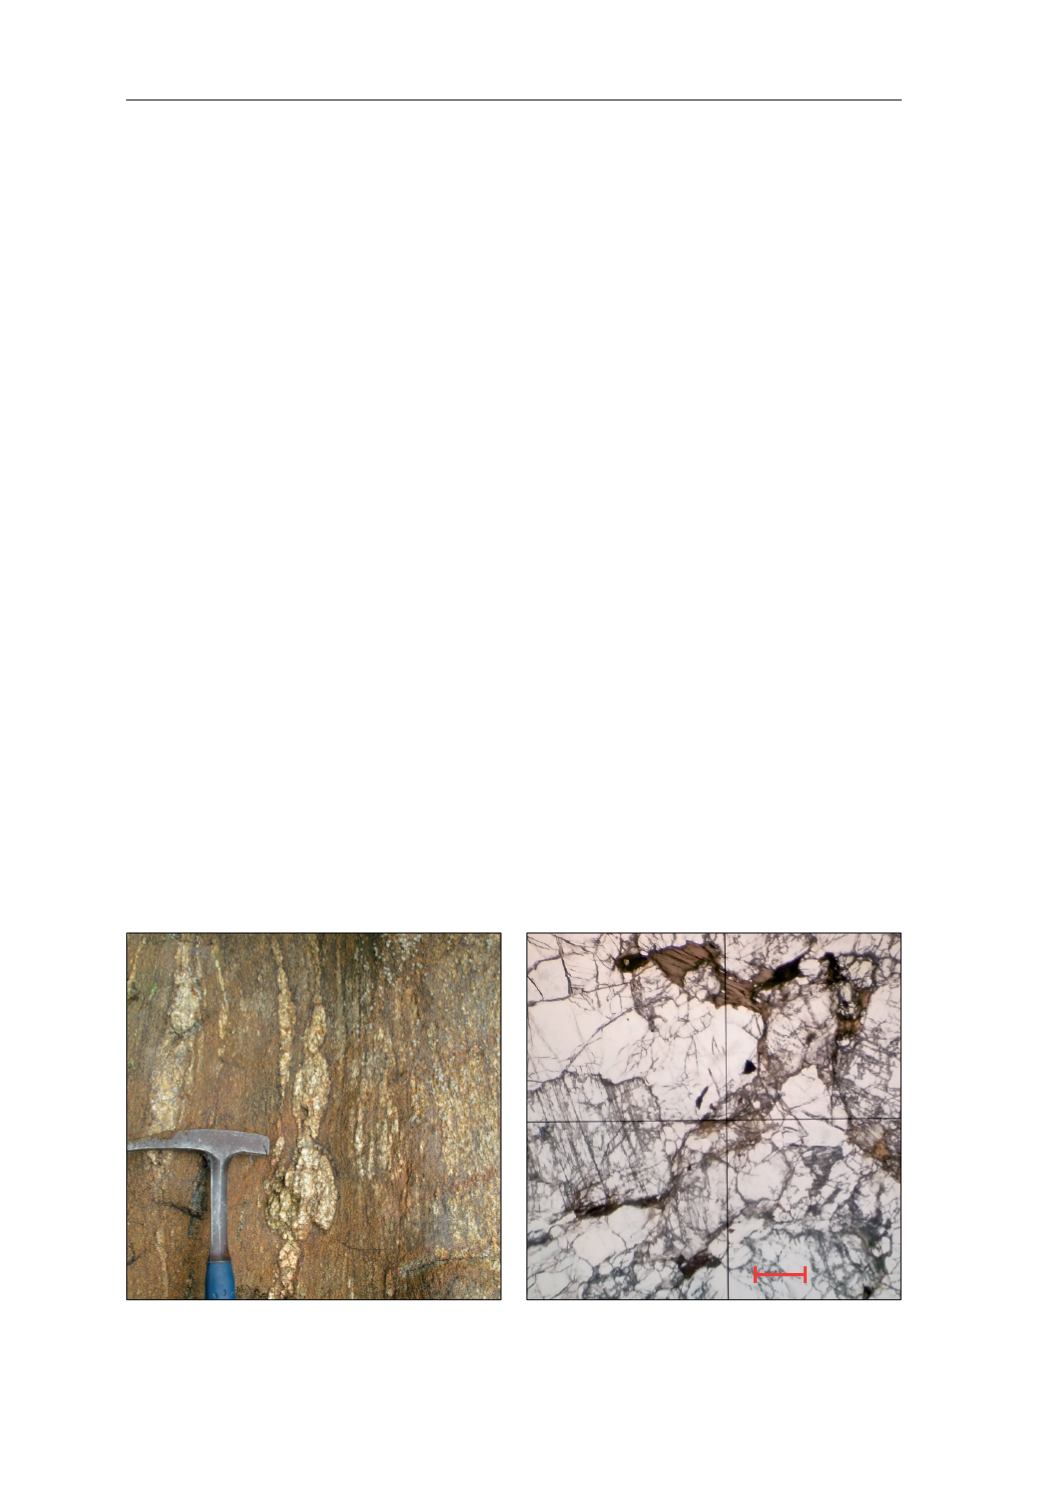
Fig. 8.
Field photograph of the studied sample. The hammer
is 13.6 cm long (not considering the blue handle).
Fig. 9.
Photomicrograph of the studied sample.
ȝP
7.2. LEUCOSOMES