


 180 / 352

164
Zircon in this sample have around 309 ppm of
U (minimum: 23, maximum: 1347), and around
32 ppm of Pb (minimum: 3, maximum: 156;
Appx. 4). Th/U ratios are always higher than 0.2
and vary from 0.28 to 9.17 (average: 1.22; Fig.
49a).
176
Lu/
177
Hf ratios vary from 0.00028 to 0.00161
(average: 0.00080; Fig. 49b).
176
Yb/
177
Hf ratios
vary from 0.0071 to 0.0529 (average: 0.0239;
Appx. 4).
Nd whole-rock model-age is 0.78 Ga and
H
Nd
(t)
values are:
H
Nd
(t=0)
= +2.1;
H
Nd
(t=508)
= +4.8.
7.3.4.2. Discussion
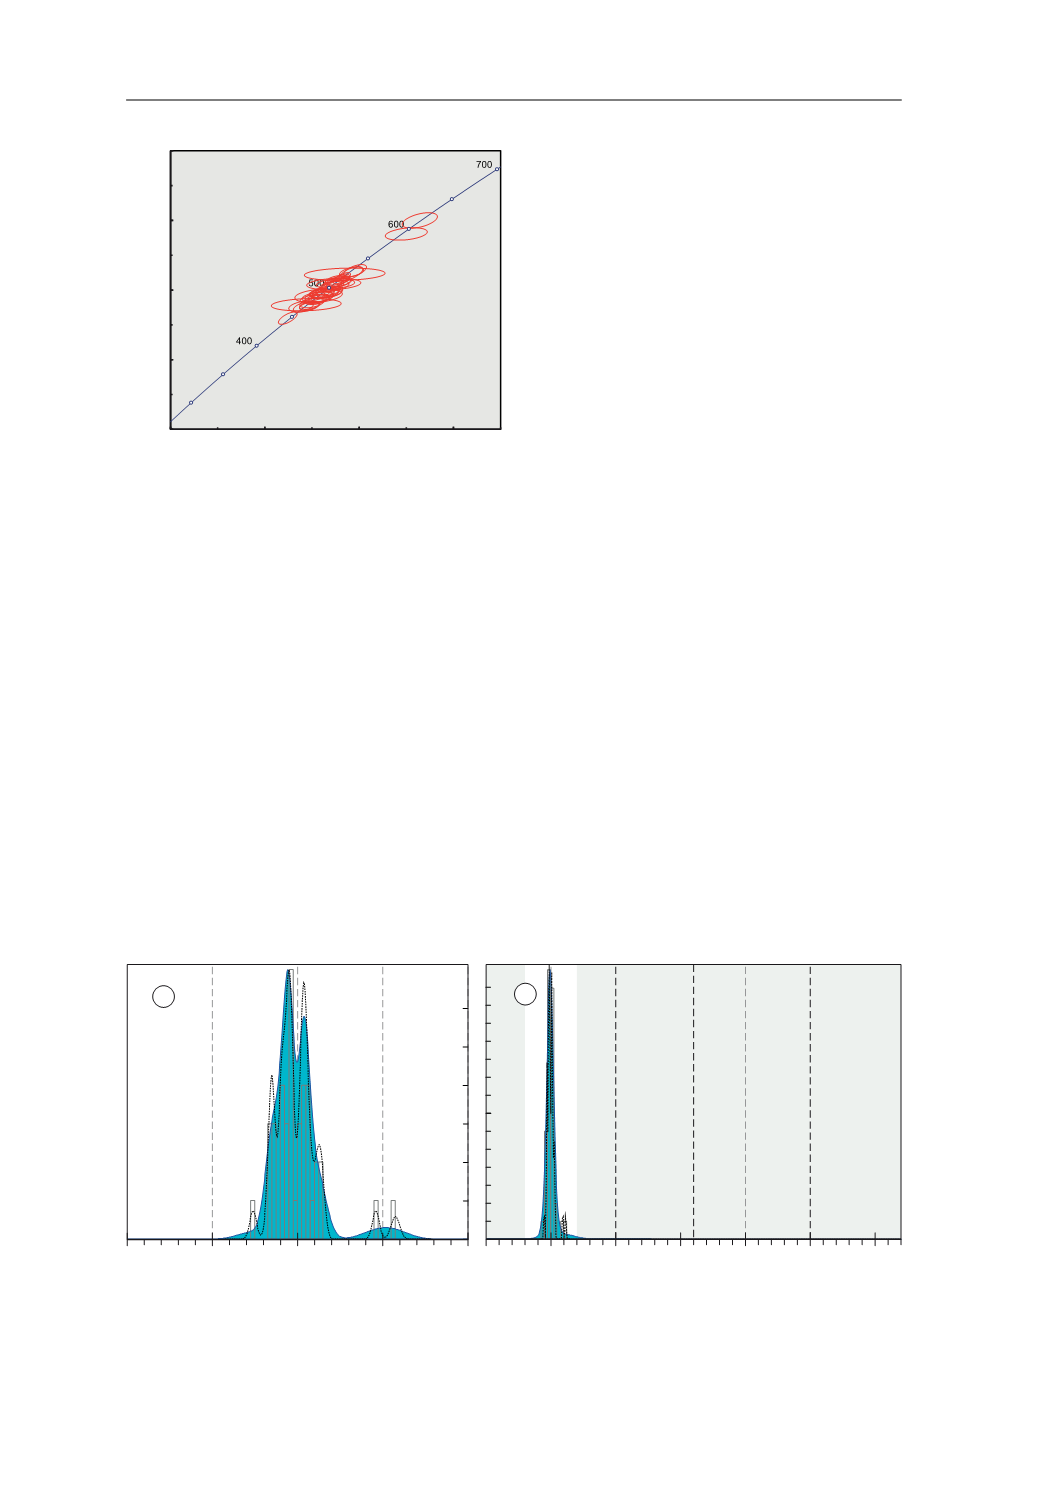
U–Pb analyses can be sub-divided into two
major groups with abundance peaks at
c.
508 and
c.
489 Ma. Another two minor subdivisions can
be observed with peaks at
c.
526 and
c.
469 Ma.
Fig. 47 shows the textures of 20 crystals, from
where it is observed a generalised development
of convoluted bright zonings and diffuse and
blurred oscillatory dark zonings. The processes
that developed these two types of textures could
not be dated becauseU–Pb ages from the analyses
taken from each of the texture types could not
distinguish two discrete ages. Nevertheless one
crystal gave an age of 507
r
6 Ma on its dark
and fainted oscillatory side and an age of 486
r
9 Ma on its light convoluted side (A141 and
A140 respectively; Fig. 47). Taking into account
that this mafic rock outcrops together with a
c.
500 Ma orthogneiss (GCH-14, section 7.4.5) and
that both lithologies outcrop together with field
relationships interpreted as a mingling process
between them, the dark fainted oscillatory
zonings seem to be related to the protolith
magmatic formation of this mafic rock at
c.
508
Ma, and the light convoluted textures seem to be
related to a high temperature input alteration,
triggered by the
c.
500Ma felsic intrusion into the
mafic rock that ultimately formed the mingling
related structures. This temperature input seems
to be responsible for the formation of the light
Fig. 45.
U-Pb conventional concordia diagram showing
U-Pb zircon analyses of the studied sample. Ellipses repre-
sent combined 2
σ
uncertainties of
206
Pb/
238
U and
207
Pb/
235
U
ratios.
n
, number of analyses considered (those with 90–
110% concordance)/total number of U–Pb analyses.
3E 8
GDWD SRLQW HUURU HOLSVHV DUH ı
3E 8
*&+
(FORJLWH
Q
Fig. 46.
Adaptative Kernel Density Estimation (aKDE, continuous line enclosing the blue area), Probability Density (PDP,
black dashed line) and histogram diagrams of the U–Pb analyses (calculated with DensityPlotter5.0, Vermeesch 2012).
Numbers in the vertical axis represent histogram frequency;
n
, number of analyses.
a
Partial plot representing data within
a 300–700 Ma time range (bandwidth = 5 Ma, binwidth = 5 Ma).
b
Complete plot (bandwidth = 15 Ma, binwidth = 25 Ma).
3DOHRSURWHUR]RLF
0HVR
SURWHUR]RLF
3DOHR]RLF DQG
1HRSURWHUR]RLF
$UFKHDQ
>0D@
Q
Q
D
E
7.3. ECLOGITES