


 179 / 352

163
7.3.4. Sample GCH-23
(Da Moura eclogite)
This sample is located in the northern part
of the
Masanteo
peninsula, at
Punta da Moura
(Appx. 1; 43°43’28.7”N, 7°51’20.0”W).
This eclogite forms part of the Banded Gneiss
formation mafic rocks. Together with the
orthogneiss sample GCH-14 (section 7.4.5) this
eclogite constitutes the
Punta da Moura
mingling
suite. Field observations suggest that this eclogite
was intruded by the orthogneiss (Fig. 43).
This sample is a fine to medium grained rock
with oriented porphyro-grano-nematoblastic
texture (Ref: 113166). Its major constituents are
Grt and Amp (most probably Hbl) and its minor
constituents are Qz, Rt, Spn, Ilm, Ap, Pl, Bt or Phl
(very scarce) and Zrn (Fig. 44). Grt is xenoblastic
due to corrosion and mineral replacements. It is
light pink and poikilitic, with many inclusions
(mainly Qz and Rt). Amp is beige-brown to
green, pleochroic and shows a “dirty” aspect. It
is zoned, with darker brown coloured rims, and
it is poikilitic, with inclusions of almost all types
of minerals within this rock (Qz, Grt, Bt, Spn, Rt,
and Zrn). These observations are explained as to
be probably due to replacement of the primary
eclogitic Cpx to Amp. Amp is also non-poikilitic,
displayed as small crystals defining the matrix
together with Qz (and probably feldspar). Qz
is relatively abundant and has weak undulose
extinction. It coexists with small Amp crystals,
forming the matrix, defining a granoblastic
amoeboid texture. It is also displayed as tabular
aggregates coherent with the foliation trend. Spn,
Rt and Ilm are relatively abundant.
7.3.4.1. Results
From this sample (GCH-23), 47U–Pb analyses
were performed of which 40 were concordant (
d
= 14.9%; Figs. 45 & 46). The U–Pb ages show two
maximum abundance peaks at 508 and 489 Ma
and relative abundances at 526 and 469 Ma (Fig.
46).
Most of the zircon in this sample shows
convoluted zonings and only in few crystals an
oscillatory zoning can be observed, which is
always fainted and not well defined (Fig. 47).
No internal features are observed in BSE images,
other than a relatively high amount of inclusions
in the zircon grains.
Epsilon Hf values vary from -5.3 to +7.4,
and the majority of them are around +4.8 ± 3.0
(
r
2 SD; Fig. 48a & Appx. 4).
176
Hf/
177
Hf
(t)
ratios
plot around 0.282581 ± 0.000200 (±2 SD) and
the majority of them plot around 0.282613 ±
0.000074 (±2 SD; Fig. 48b).
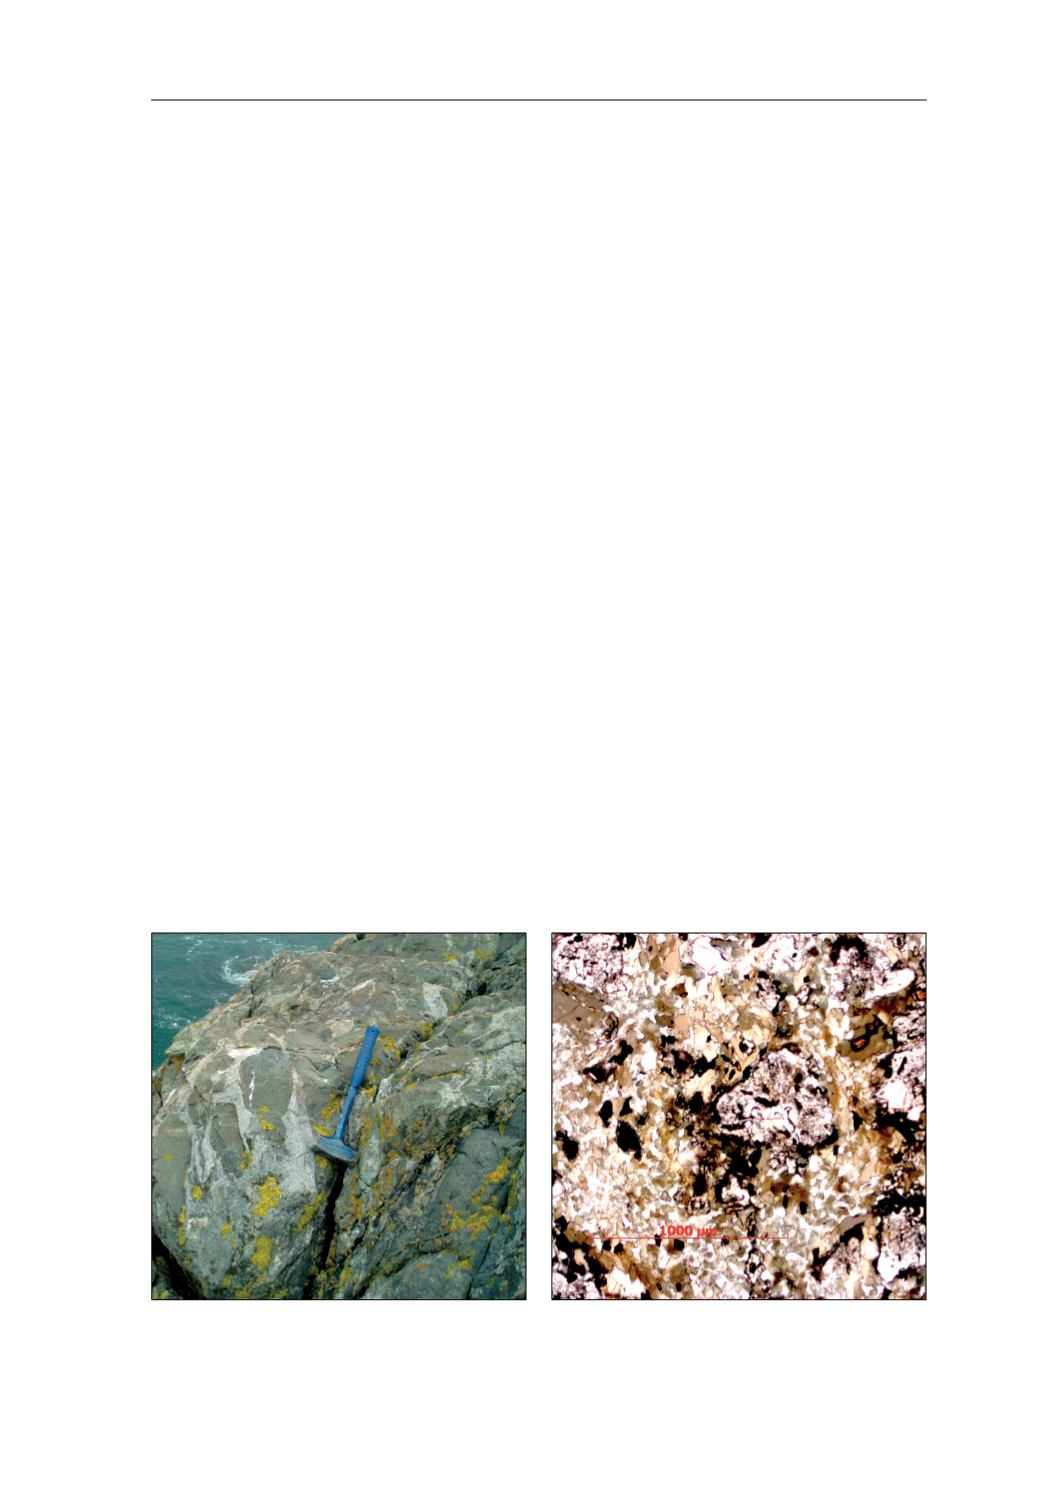
Fig. 43.
Field photograph of the studied sample. The
hammer is 40.6 cm long.
Fig. 44.
Photomicrograph of the studied sample.
7.3. ECLOGITES