


 175 / 352

159
zircon domains have white (low U) overgrowths,
texturally identical to a second type of zircon
which shows an oscillatory blurred and fainted
zoning (Fig. 40). These whitish zircon grains
and overgrowths are considered as a second
zircon type (domain II). No internal features are
observed in BSE images.
Epsilon Hf values are
c.
-2 for domain I and
c.
+3 for domain II (Fig. 41a).
176
Hf/
177
Hf
(t)
ratios for
domain I plot around 0.282461 ± 0.000019 (±2
SD) and for domain II at 0.282618 ± 0.000001
(±2 SD; Fig. 41b).
Domain I is characterised as showing a sector
dark zoning, and having
c.
450 ppm of U,
c.
35
ppm of Pb and
c.
0.2 Th/U ratio. Domain II has
an oscillatory blurred zoning, low U (
c.
30 ppm),
low Pb (
c.
3 ppm) and low Th/U ratios (
c.
0.01;
Fig. 42a & Appx. 4). Th/U ratios are in the range
of
c.
0.2 for domain I and
c.
0.01 for domain II
(Fig. 42a).
176
Lu/
177
Hf ratios are around
c.
0.00045 for
domain I and
c.
0.00001 for domain II (Fig. 42b).
176
Yb/
177
Hf ratios are around
c.
0.0130 for domain
I and
c.
0.0003 for domain II (Appx. 4).
Nd whole-rock model-age is 1.10 Ga and
H
Nd
(t)
values are:
H
Nd
(t=0)
= -8.0;
H
Nd
(t=473)
= -2.2.
7.3.3.2. Discussion
U–Pb analyses can be sub-divided into three
groups with relative abundances at 482–473, 444
and 395 Ma. The oldest ages (
i.e.
482–473 Ma)
are assumed to be the age of protolith magmatic
crystallisation. It can be argued that these zircon
grains are metamorphic instead of magmatic (as
already stated by Bernard-Griffiths
et al.
, 1985
and Peucat
et al.
, 1990; TIMS, U–Pb discordia
line upper intercept). This is possible but highly
unlikely, because their textures suggest an
igneous origin and no older cores are found, and
this would imply that
c.
480 Ma zircon grains
were all formed by metamorphism, which is
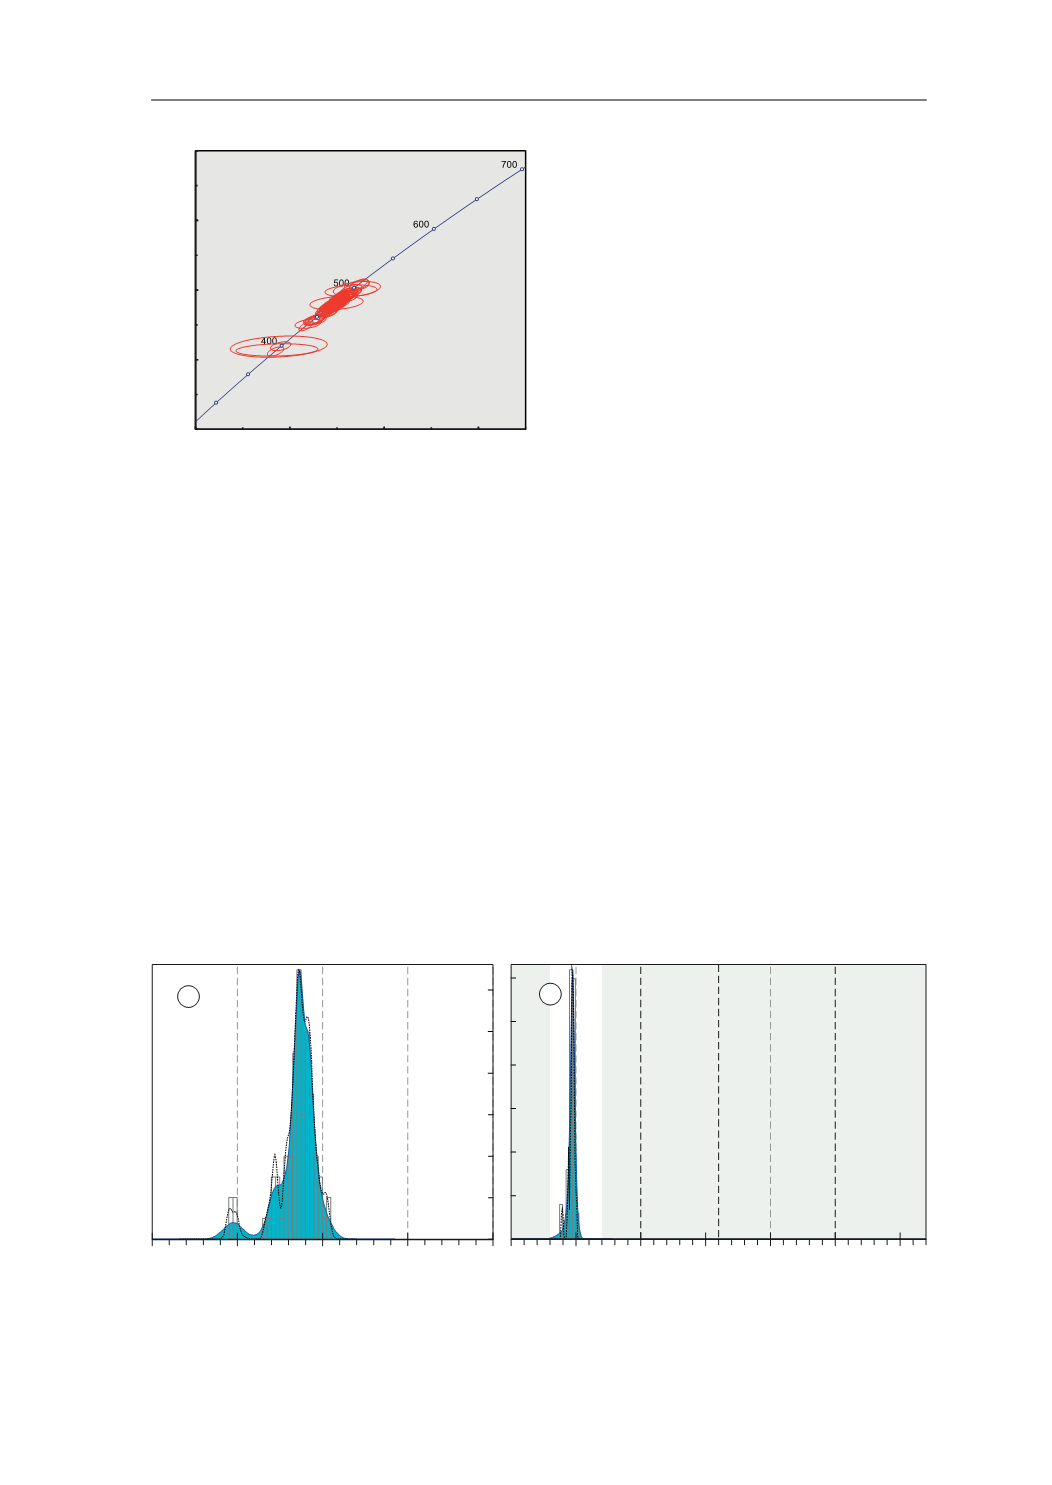
Fig. 38.
U-Pb conventional concordia diagram showing
U-Pb zircon analyses of the studied sample. Ellipses repre-
sent combined 2
σ
uncertainties of
206
Pb/
238
U and
207
Pb/
235
U
ratios.
n
, number of analyses considered (those with 90–
110% concordance)/total number of U–Pb analyses.
3E 8
GDWD SRLQW HUURU HOLSVHV DUH ı
3E 8
*&+
(FORJLWH
Q
Fig. 39.
Adaptative Kernel Density Estimation (aKDE, continuous line enclosing the blue area), Probability Density (PDP,
black dashed line) and histogram diagrams of the U–Pb analyses (calculated with DensityPlotter5.0, Vermeesch 2012).
Numbers in the vertical axis represent histogram frequency;
n
, number of analyses.
a
Partial plot representing data within
a 300–700 Ma time range (bandwidth = 5 Ma, binwidth = 5 Ma).
b
Complete plot (bandwidth = 15 Ma, binwidth = 25 Ma).
3DOHRSURWHUR]RLF
0HVR
SURWHUR]RLF
3DOHR]RLF DQG
1HRSURWHUR]RLF
$UFKHDQ
>0D@
Q
Q
D
E
7.3. ECLOGITES