


 185 / 352

169
within the MORB-depleted mantle field, with
H
Hf
(t)
values between +7.9 and +11.6. Domain
II
H
Hf
(t)
values are slightly lower than domain I
H
Hf
(t)
values, with values between +6.8 and +8.3
(Fig. 55a & Appx. 4).
176
Hf/
177
Hf
(t)
ratios for all
zircon grains (without considering the above-
mentioned exceptions) plot around 0.282745 ±
0.000052 (±2 SD; Fig. 55b).
Domain I zircon has around 255 ppm of U
(minimum: 95, maximum: 683) and around 21
ppmof Pb (minimum: 8, maximum: 58). Domain
II zircon has higher values, with around 834 ppm
of U (minimum: 139, maximum: 1897; and one
zircon grain with 42 ppm) and around 51 ppm of
Pb (minimum: 11, maximum: 128; and one Zrn
with 3 ppm; Appx. 4). All domain I analyses have
Th/U ratios higher than 0.2, and vary from 0.23
to 1.00 (average: 0.42; Fig. 56a). The majority of
domain II analyses have Th/U ratios lower than
0.2, and vary from 0.003 to 0.62 (average: 0.08;
Fig. 56a).
176
Lu/
177
Hf ratios for domain I zircon are higher
than 0.00100 and
176
Lu/
177
Hf ratios for domain
II zircon are lower (with some exceptions) than
0.00013 (Fig. 56b).
176
Yb/
177
Hf ratios for domain
I zircon plot around
c.
0.0529, and those for
domain II are much lower and plot around
c.
0.0048 (Appx. 4).
Nd whole-rock model-age is 0.76 Ga and
H
Nd
(t)
values are:
H
Nd
(t=0)
= +4.3;
H
Nd
(t=496)
= +5.7.
7.4.1.2. Discussion
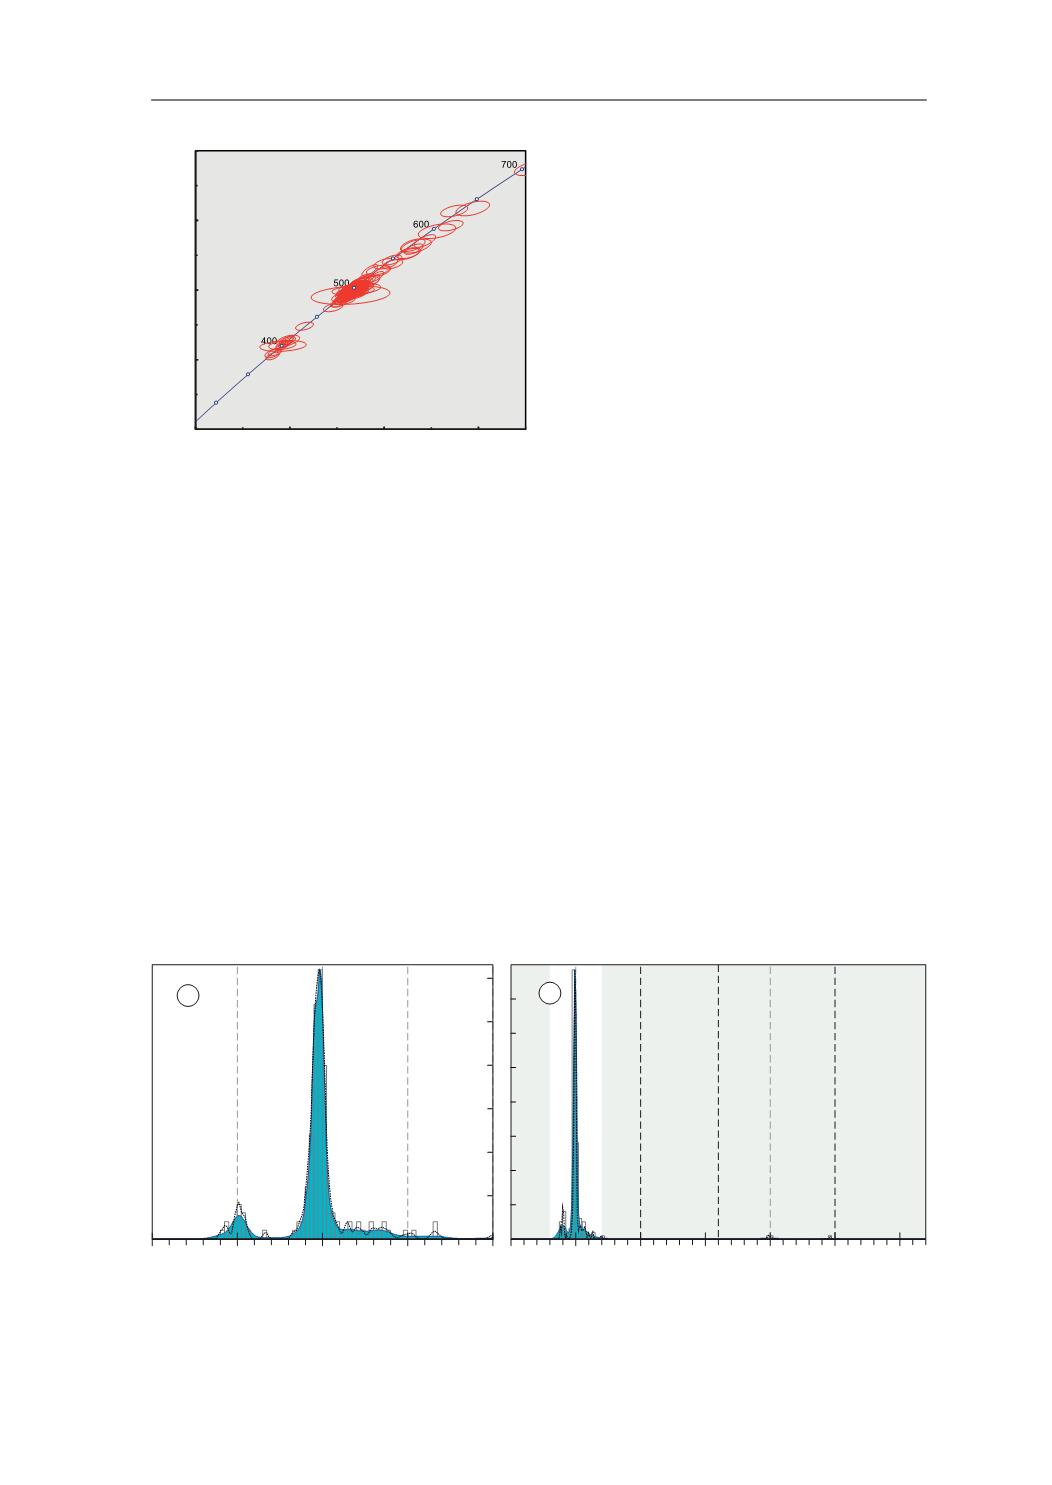
U–Pb analyses can be sub-divided into two
groups, domain I with a maximum abundance
age peak at 496 Ma and domain II with a
maximum abundance age peak at 402 Ma.
Other older analyses (16 between
c.
700 and
540 Ma and other three Paleoproterozoic) are
considered inheritances. Zircon corresponding
to domain I show combined oscillatory and
multi-faceted or sector (“soccerball”) textures
(Fig. 54). Bright lobulated sinuous small rims
Fig. 52.
U-Pb conventional concordia diagram showing
U-Pb zircon analyses of the studied sample. Ellipses repre-
sent combined 2
σ
uncertainties of
206
Pb/
238
U and
207
Pb/
235
U
ratios.
n
, number of analyses considered (those with 90–
110% concordance)/total number of U–Pb analyses.
3E 8
GDWD SRLQW HUURU HOLSVHV DUH ı
3E 8
*&+
2UWKRJQHLVV
Q
Fig. 53.
Adaptative Kernel Density Estimation (aKDE, continuous line enclosing the blue area), Probability Density (PDP,
black dashed line) and histogram diagrams of the U–Pb analyses (calculated with DensityPlotter5.0, Vermeesch 2012).
Numbers in the vertical axis represent histogram frequency;
n
, number of analyses.
a
Partial plot representing data within
a 300–700 Ma time range (bandwidth = 5 Ma, binwidth = 5 Ma).
b
Complete plot (bandwidth = 15 Ma, binwidth = 25 Ma).
3DOHRSURWHUR]RLF
0HVR
SURWHUR]RLF
3DOHR]RLF DQG
1HRSURWHUR]RLF
$UFKHDQ
Q
Q
>0D@
D
E
7.4. ORTHOGNEISSES