


 190 / 352

174
176
Lu/
177
Hf ratios plot around 0.00144 ±
0.00134 (±2 SD; Fig. 63b).
176
Yb/
177
Hf ratios plot
around 0.0456 ± 0.0450 (±2 SD; Appx. 4).
Nd whole-rock model-age is 0.75 Ga and
H
Nd
(t)
values are:
H
Nd
(t=0)
= +2.5;
H
Nd
(t=485)
= +5.0.
7.4.2.2. Discussion
The U–Pb ages are spread between
c.
510 and
450 Ma, with a maximum abundance peak at 485
Ma (Fig. 60). The textures shown by the zircon
grains in this sample vary from “soccerball”, to
oscillatory, to transgressive recrystallisation
areas. These types of textures could not be linked
to specific age ranges or to any chemical variation
ratios. The only exception is the transgressive
recrystallisation areas, where two U–Pb analyses
were performed, with ages of 378
r
7 and 430
r
23 Ma (Fig. 61). These areas are interpreted as
to be the result of a solid-state recrystallisation
event dated in other samples at
c.
390 Ma. The
rest of the ages in this sample, that vary between
c.
510 and 450 Ma, show a wide spread in their U,
Pb, Lu and Yb contents. Their higher
H
Hf
(t)
values
plot in the MORB-depleted mantle field (higher
value: +9.2) and their lower values plot very near
the CHUR trend (lower value: +1.3; Fig. 62a).
Their
176
Hf/
177
Hf
(t)
values also present a high
variation and no tendency in their values was
found in relation to their U–Pb ages. This wide
range in their U–Pb ages and the wide range in
their chemical compositions can be explained
by a rejuvenation process via Pb-loss triggered
by the
c.
390 Ma recrystallisation event. This
explanation does not seem satisfactory due to the
very lowproportionof discordant analyses (2.5%)
and to the high concordance achieved by the U–
Pb zircon ages (69 out of 122 analyses are 98–
102% concordant). Another explanation could
be that the protolith magmatic material started to
crystallise zircon with high-T related “soccerball”
textures (
e.g.
A046 and A059; Fig. 61) and that
before the magmas completely crystallised they
were mixed with other magmas with different
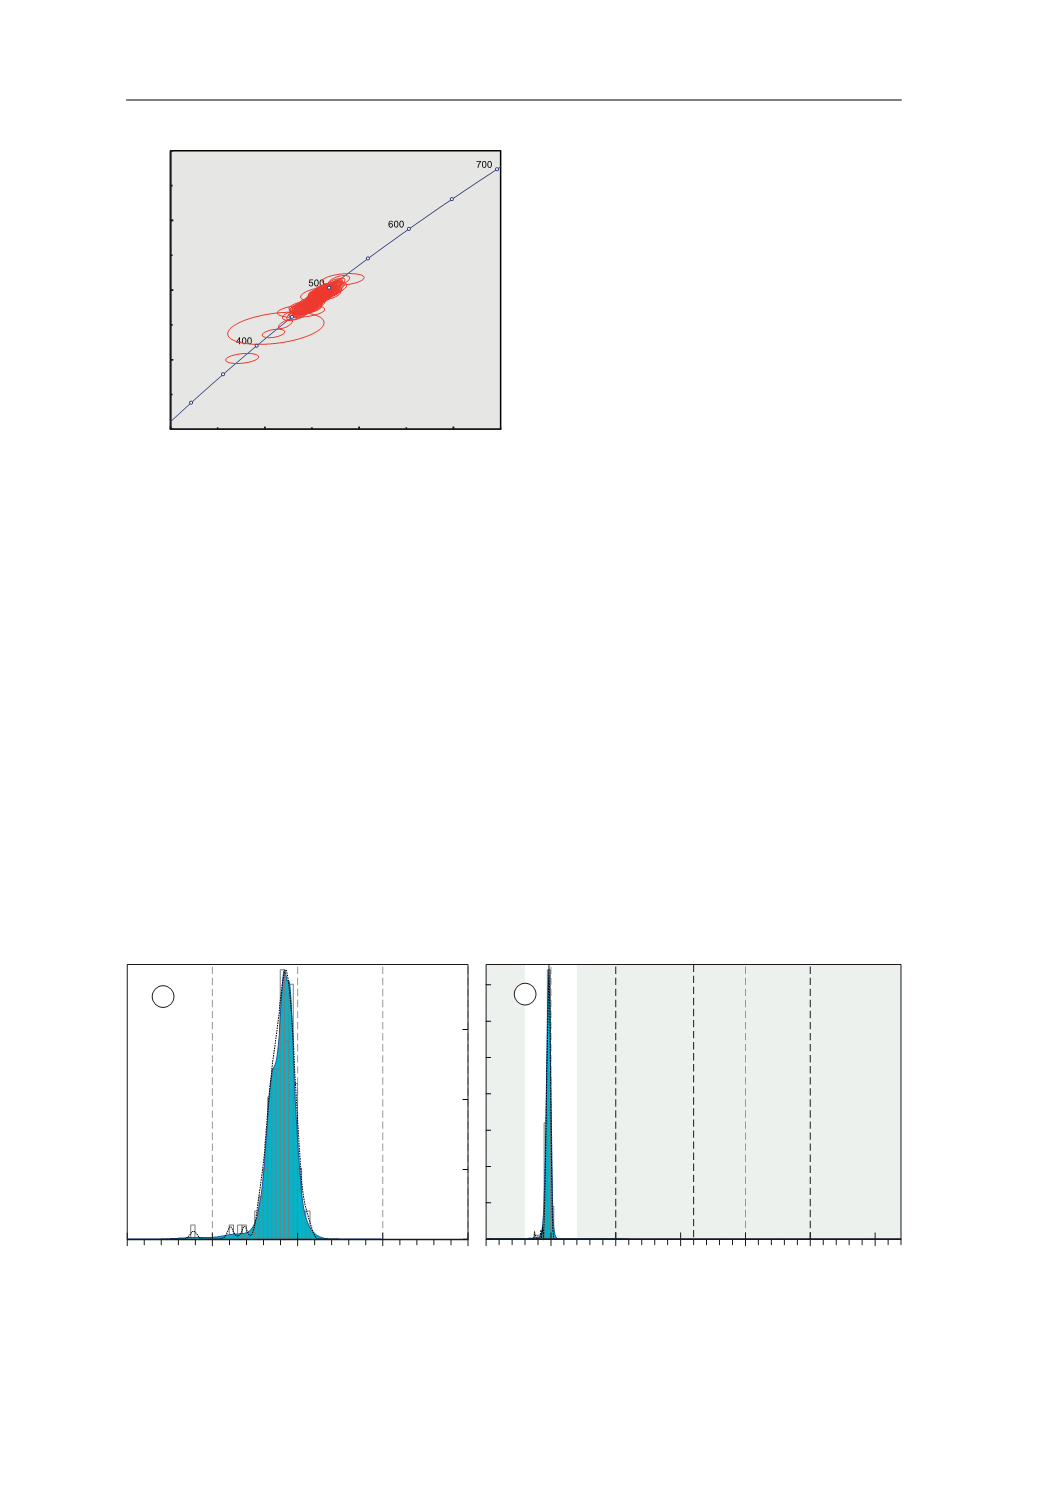
Fig. 59.
U-Pb conventional concordia diagram showing
U-Pb zircon analyses of the studied sample. Ellipses repre-
sent combined 2
σ
uncertainties of
206
Pb/
238
U and
207
Pb/
235
U
ratios.
n
, number of analyses considered (those with 90–
110% concordance)/total number of U–Pb analyses.
3E 8
GDWD SRLQW HUURU HOLSVHV DUH ı
3E 8
*&+
2UWKRJQHLVV
Q
Fig. 60.
Adaptative Kernel Density Estimation (aKDE, continuous line enclosing the blue area), Probability Density (PDP,
black dashed line) and histogram diagrams of the U–Pb analyses (calculated with DensityPlotter5.0, Vermeesch 2012).
Numbers in the vertical axis represent histogram frequency;
n
, number of analyses.
a
Partial plot representing data within
a 300–700 Ma time range (bandwidth = 5 Ma, binwidth = 5 Ma).
b
Complete plot (bandwidth = 15 Ma, binwidth = 25 Ma).
3DOHRSURWHUR]RLF
0HVR
SURWHUR]RLF
3DOHR]RLF DQG
1HRSURWHUR]RLF
$UFKHDQ
>0D@
Q
Q
D
E
7.4. ORTHOGNEISSES