


 189 / 352

173
7.4.2. Sample GCH-03
(Area da Vaca orthogneiss, 100 m)
This sample was collected from the
Area da
Vaca
beach (43°43’27.8”N, 7°51’35.1”W), at
the 100 m point of the
Area da Vaca
geological
section (Appx. 1).
This orthogneiss outcrops as a
c.
50 centimetre
thick melanocratic felsic rock within the
metasedimentary rocks. It is displayed as a
boudin wrapped by the metasedimentary rocks
regional foliation (Fig. 57). It outcrops at the 100
m point of the
Area da Vaca
geological section;
chapter 4).
From microscopic observations this sample
has a porphyro-grano-lepidoblastic texture
(Fig. 58; Ref: 112975). Grt porphyroblasts are
xenoblastic and poikilitic, with an extreme
amount of inclusions (mainly Qz). The
lepidoblastic texture is defined by a great amount
of Chl, which is displayed together with Spn and
Ap. Qz and Afs are displayed with a granoblastic
interlobate texture where Qz is also displayed as
elongated poly-crystals. Other constituents are
Zrn and small quantities of Rt and Ilm.
7.4.2.1. Results
From this sample (GCH-03), 122 U–Pb
analyses were performed of which 119 were
concordant (
d
= 2.5%; Figs. 59 & 60). The U–Pb
ages are spread between
c.
510 and 450 Ma, with
a maximum abundance peak at 485 Ma, and with
no inherited zircon (Fig. 60a).
The zircon grains from this sample present a
wide variety of textures. They show well defined
to faded multi-faceted habits (“soccerball
habit”). Other zircon grains show badly defined
oscillatory zonings and others show transgressive
recrystallisation areas that are internally
featureless and have sinuous and lobulated edges
(A075 and A164; Fig. 61). All zircon grains show
bright rims in the CL images and some zircon
grains are fragments (A074 and A093; Fig. 61).
No internal features are observed in BSE images.
H
Hf
(t)
values of all analysed zircon grains are
positive with an average value of +4.5 (minimum:
+1.3, maximum: +9.2; Fig. 62a).
176
Hf/
177
Hf
(t)
ratios plot around 0.282645 ± 0.000115 (±2 SD;
Fig. 62b).
All zircon grains have an average content of
U of 538 ppm (minimum: 28, maximum: 2298)
and an average of 48 ppm of Pb (minimum: 2.6,
maximum: 256; Appx. 4). The majority of the
zircon grains have Th/U ratios higher than 0.2,
with an average value of 0.52 (minimum: 0.24,
maximum: 1.26). Only three analyses have lower
Th/U values lower than 0.2 (Fig. 63a).
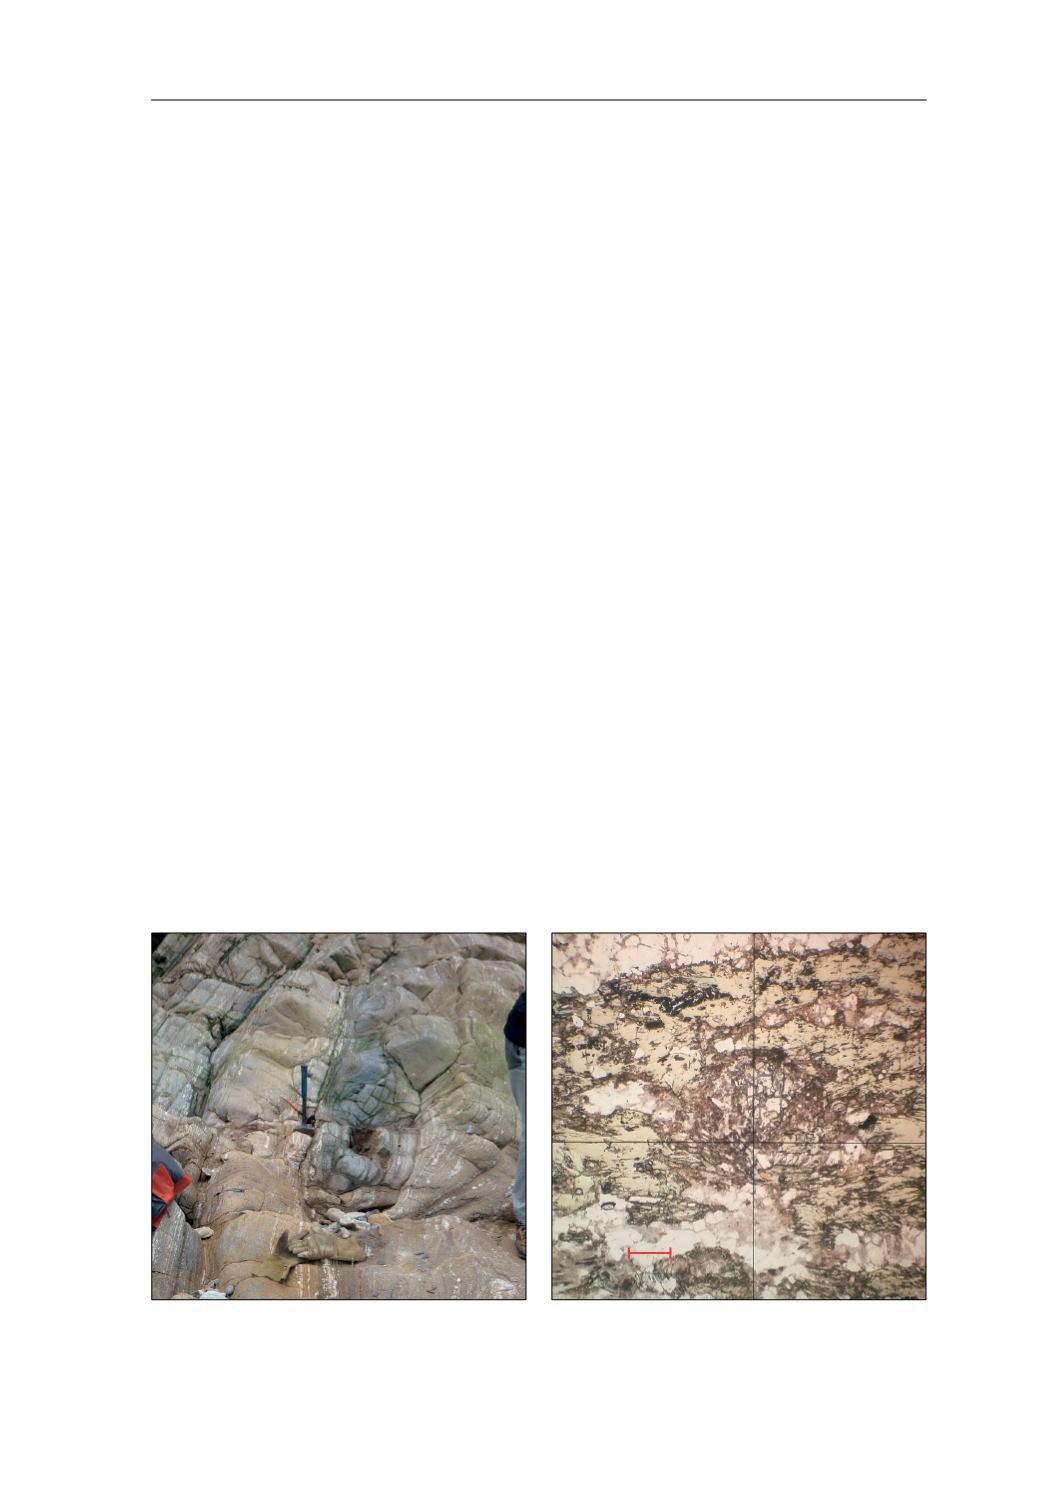
Fig. 57.
Field photograph of the studied sample. The
hammer is 40.6 cm long.
Fig. 58.
Photomicrograph of the studied sample.
ȝP
7.4. ORTHOGNEISSES