


 191 / 352

175
compositions, and zircon continued crystallising
with oscillatory textures (
e.g.
A111 and A065;
Fig. 61). The system cooled very slowly due to
a long term high-T input associated with the
mixing and the arc environment in which this
orthogneiss crystallised and developed. This
interpretation seems possible but is not fully
supported by the data presented in this work. The
only certain conclusions from this sample is that
the orthogneiss protolithic material crystallised
sometime around
c.
485 Ma and that a posterior
recrystallisation event altered the zircon textures
without triggering any rare element purge driven
by solid-state recrystallisation processes from
the zircon structure.
$
ڙ
$
ڙ
$
ڙ
$
ڙ
$
ڙ
$
$
$
ڙ
$
$
$
ڙ
$
ڙ
$
ڙ
$
ڙ
$
ڙ
$
ڙ
$
ڙ
$
ڙ
$
ڙ
ȝP
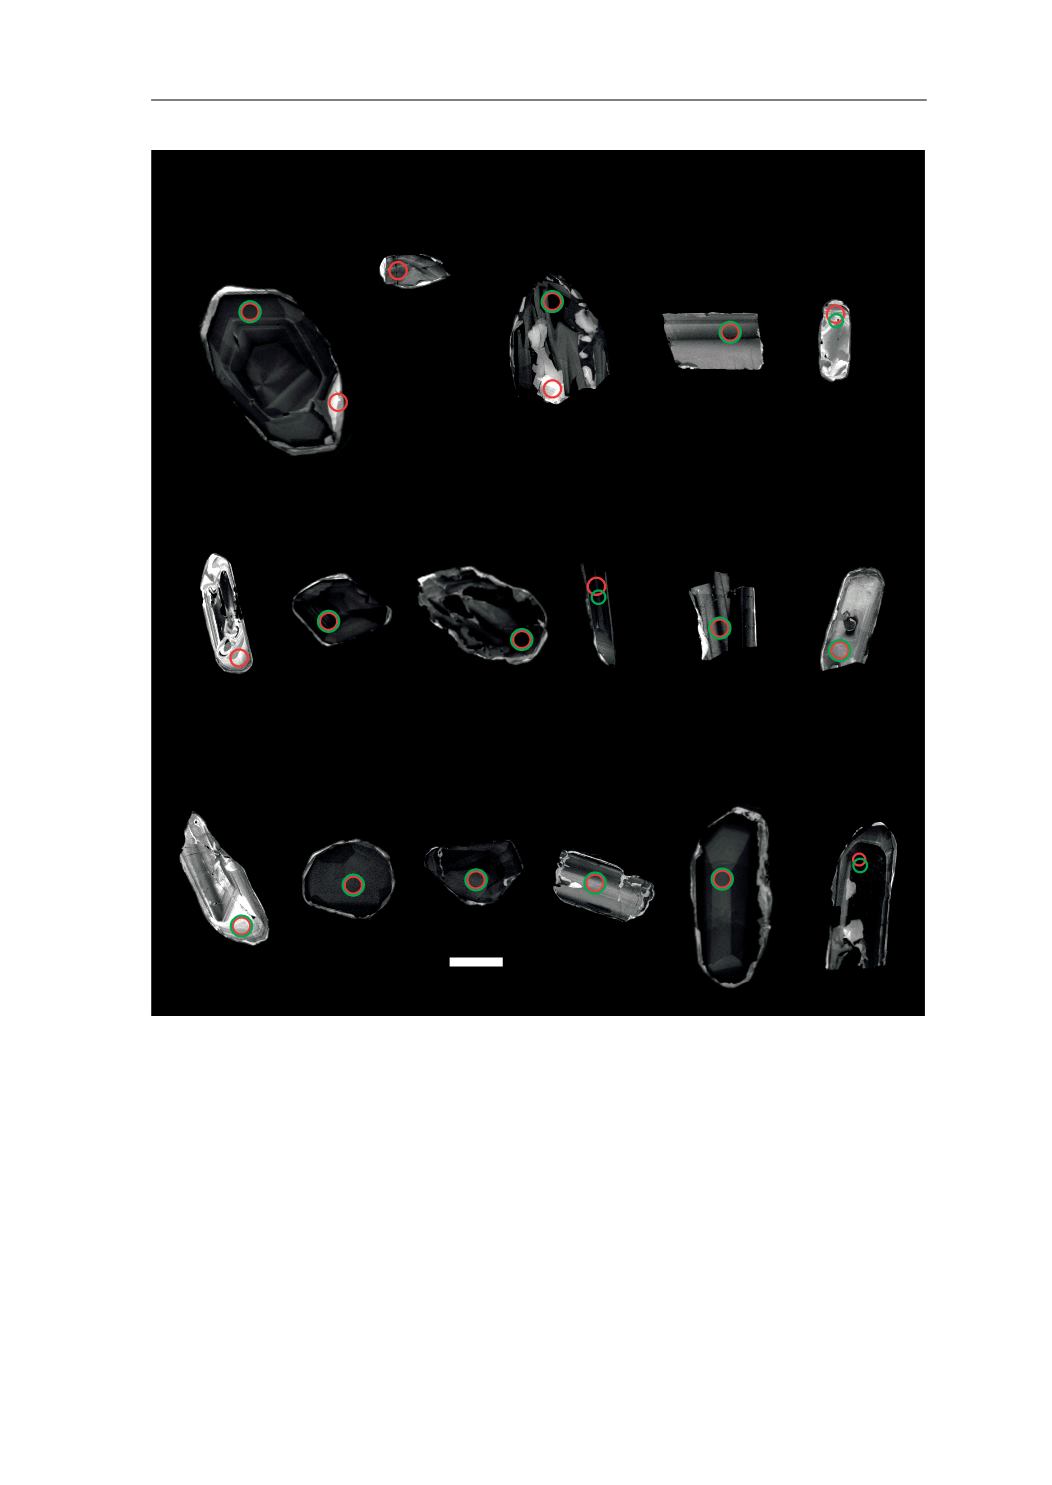
Fig. 61.
CL (cathodoluminescence) images of representative zircons from the studied sample. Laser ablation pits for U–Pb
analyses (red line circles) have 23 and 33
μ
m diameters. Laser ablation pits for Lu–Hf analyses (green line circles) have 26
and 40
μ
m diameters. White numbers are the reference number of the analysis, red numbers are the U–Pb age and its 2
σ
error (Ma) and the green numbers are the
H
Hf values for the U–Pb age.
7.4. ORTHOGNEISSES