


 195 / 352

179
maximum: 337; Appx. 4). The majority of the
zircon grains have Th/U ratios higher than 0.2,
with an average value of 0.82 (minimum: 0.18,
maximum: 1.51). Only one analysis has lower
Th/U values lower than 0.2 (Fig. 70a).
176
Lu/
177
Hf ratios plot around 0.00122 ±
0.00126
r
2 SD; Fig. 70b).
176
Yb/
177
Hf ratios plot
around 0.0389 ± 0.0409 (±2 SD; Appx. 4).
Nd whole-rock experiments failed to calculate
a model-age, because the
147
Sm/
144
Nd ratio
calculated for this sample has a negative slope
in the
H
Nd
(t)
v.
age plot (higher value than
CHURs
147
Sm/
144
Nd value of 0.1967; Jacobsen &
Wasserburg, 1980). Epsilon value for present day
is:
H
Nd
(t=0)
= -0.6.
7.4.3.2. Discussion
Zircon from this sample shows a high
variety of textures and chemical ratios and
values. It has not been possible to relate these
observations with certain age ranges. The
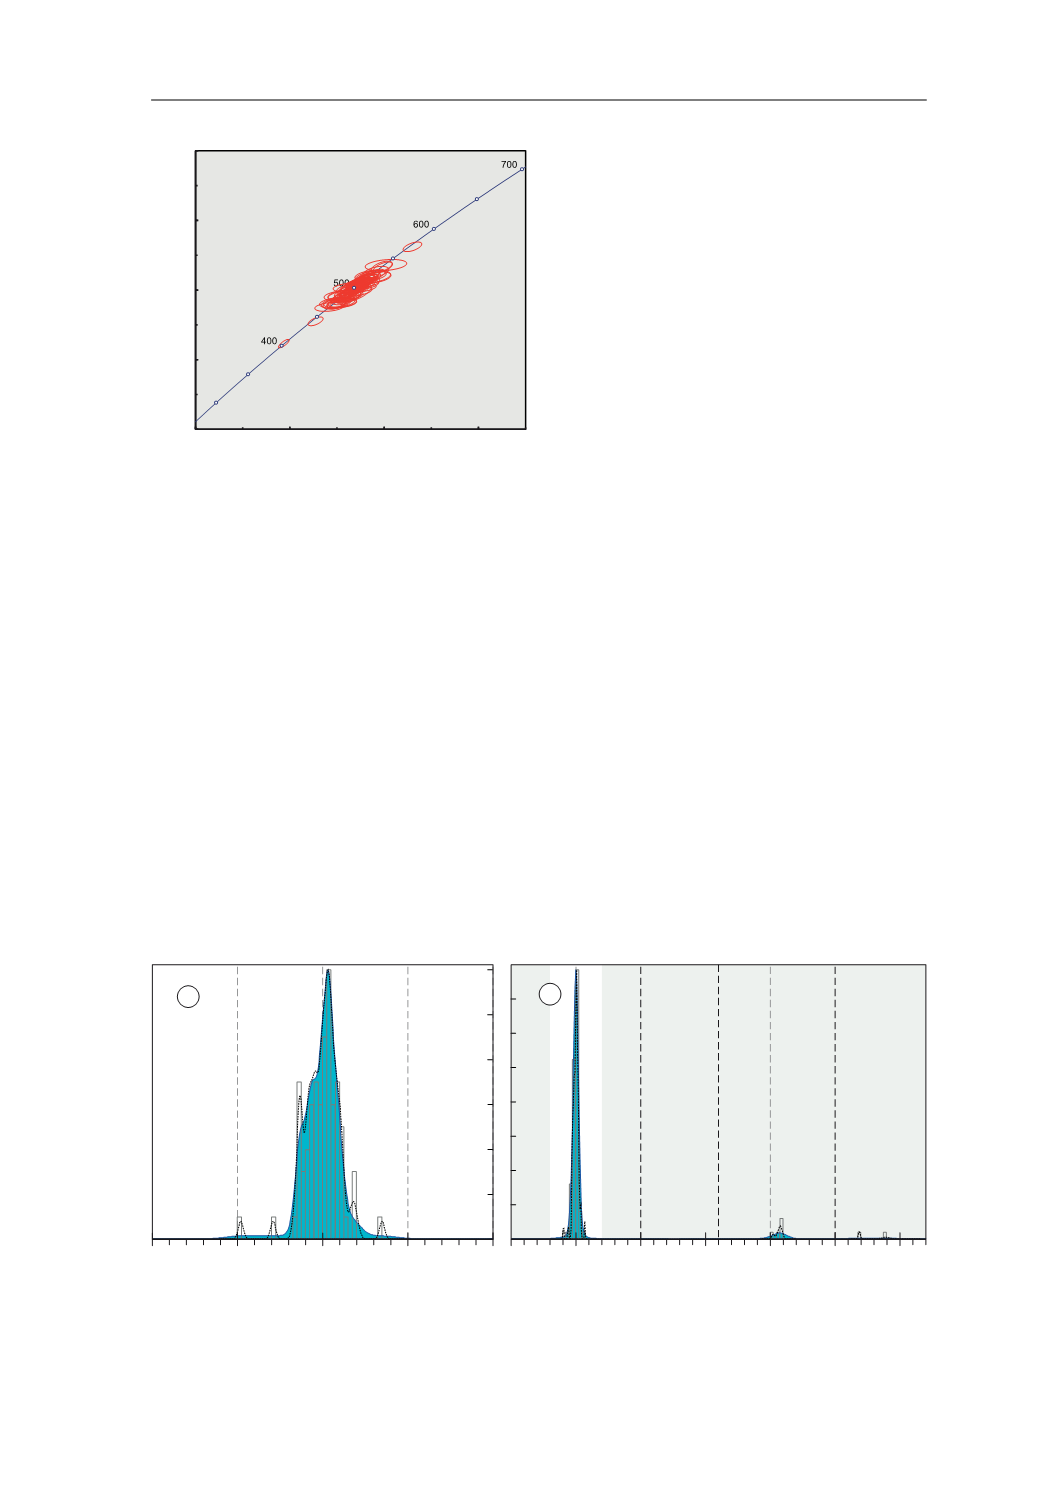
maximum abundance peak of 504 Ma (Fig. 67)
is interpreted as the age of igneous crystallisation
of the protolithic felsic magmas. The variety of
textures displayed (Fig. 68) points to a complex
evolution after crystallisation, and possibly to
complex crystallisation processes where a high
number of inherited zircon grains may have
played an important role. The high variability
in their
H
Hf
(t)
values is not compatible with a
direct crystallisation of the whole population of
zircon from an homogeneous fluid phase (Fig.
69a). The high and varied Th/U,
176
Lu/
177
Hf and
176
Yb/
177
Hf ratios constitute evidence that zircon
was not subjected to a rare element purge due to
solid-state recrystallisation processes (Fig. 70 &
Appx. 4). But a pseudomorphic recrystallisation
process seems probable and expected from
textural observations, as the oscillatory
patterns are normally blurred and faded (Fig.
68). Other textural observations such as the
alotriomorphic character of zircon habits, point
to a fragmentation of the zircon grains due to
Fig. 66.
U-Pb conventional concordia diagram showing
U-Pb zircon analyses of the studied sample. Ellipses repre-
sent combined 2
σ
uncertainties of
206
Pb/
238
U and
207
Pb/
235
U
ratios.
n
, number of analyses considered (those with 90–
110% concordance)/total number of U–Pb analyses.
3E 8
GDWD SRLQW HUURU HOLSVHV DUH ı
3E 8
*&+
2UWKRJQHLVV
Q
Fig. 67.
Adaptative Kernel Density Estimation (aKDE, continuous line enclosing the blue area), Probability Density (PDP,
black dashed line) and histogram diagrams of the U–Pb analyses (calculated with DensityPlotter5.0, Vermeesch 2012).
Numbers in the vertical axis represent histogram frequency;
n
, number of analyses.
a
Partial plot representing data within
a 300–700 Ma time range (bandwidth = 5 Ma, binwidth = 5 Ma).
b
Complete plot (bandwidth = 15 Ma, binwidth = 25 Ma).
3DOHRSURWHUR]RLF
0HVR
SURWHUR]RLF
3DOHR]RLF DQG
1HRSURWHUR]RLF
$UFKHDQ
>0D@
Q
Q
D
E
7.4. ORTHOGNEISSES