


 194 / 352

178
7.4.3. Sample GCH-13
(Figueiroa orthogneiss)
This sample was collected from
Figueiroa
beach (43°42’41.1”N, 7°51’50.3”W), at the 160
m point of the
Figueiroa
beach geological section
(chapter 4).
This orthogneiss outcrops as a
c.
20–30
centimetre thick leucocratic felsic rock intruding
the metasedimentary rocks (Fig. 64). It outcrops
at the 160 m point of the
Figueiroa
geological
section (chapter 4).
From microscopic observations this sample
has a grano-lepidoblastic texture (Ref: 112985).
Qz and Afs are the major constituents (Fig. 65).
The matrix is formed mainly by small crystals of
altered Afs and Qz, and altered white mica (most
probablyMs). Qz is displayed as tabular elongated
amoeboid poly-crystals. Other constituents
are Grt and Zrn. Small subidioblastic corroded
and altered crystals of Grt were found in small
quantities.
7.4.3.1. Results
From this sample (GCH-13), 92U–Pb analyses
were performed of which 87 were concordant (
d
= 5.4%; Figs. 66 & 67). The U–Pb ages are spread
between
c.
530 and 460 Ma, with a maximum
abundance peak at 504 Ma and with relative
abundances at 536, 486 and 473 Ma (Fig. 67).
There are seven analyses with ages older than 600
Ma, which are considered inheritances.
The zircon grains from this sample show a
wide variety of textures. Some of the zircon
grains show more or less well defined oscillatory
growth patterns (
e.g.
A012; Fig. 68), others show
sinuous oscillatory patterns (
e.g.
A095; Fig. 68)
and others faded oscillatory or even structure-
less textures (
e.g.
A047; Fig. 68). The great
majority of these zircon grains are fragments
(Fig. 68). There is also another type of zircon,
which is smaller than the previously described. It
is much darker (CL images) and shows a higher
number of inclusions (BSE images). Its textures
are defined by oscillatory growth patterns which
are faded and in some cases sinuous (
e.g.
A019;
Fig. 68). No internal features are observed in
BSE images, with the exception of the inclusions
above-mentioned.
H
Hf
(t)
values for all zircon grains plot with
an average value of +0.3 (minimum: -12.4,
maximum: +8.0; Fig. 69a).
176
Hf/
177
Hf
(t)
ratios
plot around 0.282305 ± 0.000883
r
2 SD; Fig.
69b).
All zircon grains have an average content of
U of 552 ppm (minimum: 45, maximum: 3570)
and an average of 53 ppm of Pb (minimum: 7,
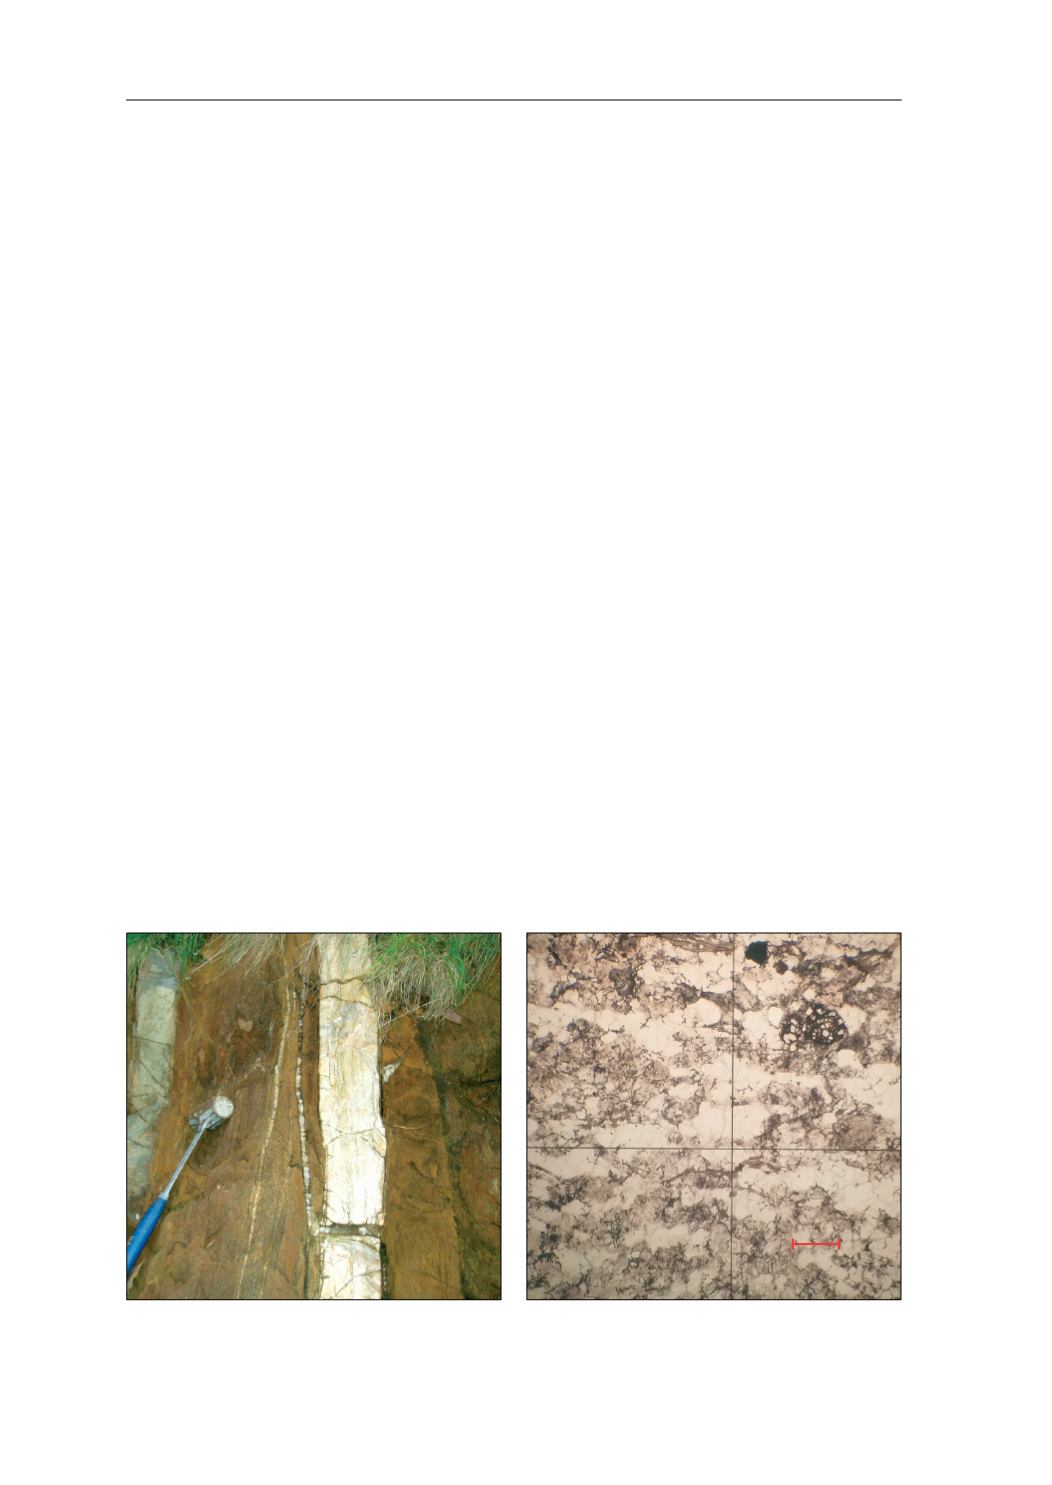
Fig. 64.
Field photograph of the studied sample. The
hammer is 40.6 cm long.
Fig. 65.
Phtomicrograph of the studied sample.
ȝP
7.4. ORTHOGNEISSES