


 208 / 352

192
by a solid-sate recrystallisation process of their
corresponding cores. This is the case of core
A218 (0.282480) and rim A217 (0.282446; Fig.
89 and Appx. 4). In other cases
176
Hf/
177
Hf
(t)
ratios of cores and rims are totally different
(rim A205 and core A206 have
176
Hf/
177
Hf
(t)
ratios of 0.282400 and 0.281676 respectively)
implying that the rim is an overgrowth grown
from a different liquid phase with a different
176
Hf/
177
Hf
(t)
ratio than its core. Also, Th/U and
176
Lu/
177
Hf ratios do not show any correlation
with their U–Pb ages (Fig. 91). The only data that
$
ڙ
$
ڙ
$
ڙ
$
ڙ
$
ڙ
$
ڙ
$
1R GDWD
ڙ
$
ڙ
$
ڙ
$
ڙ
$
$
$
ȝP
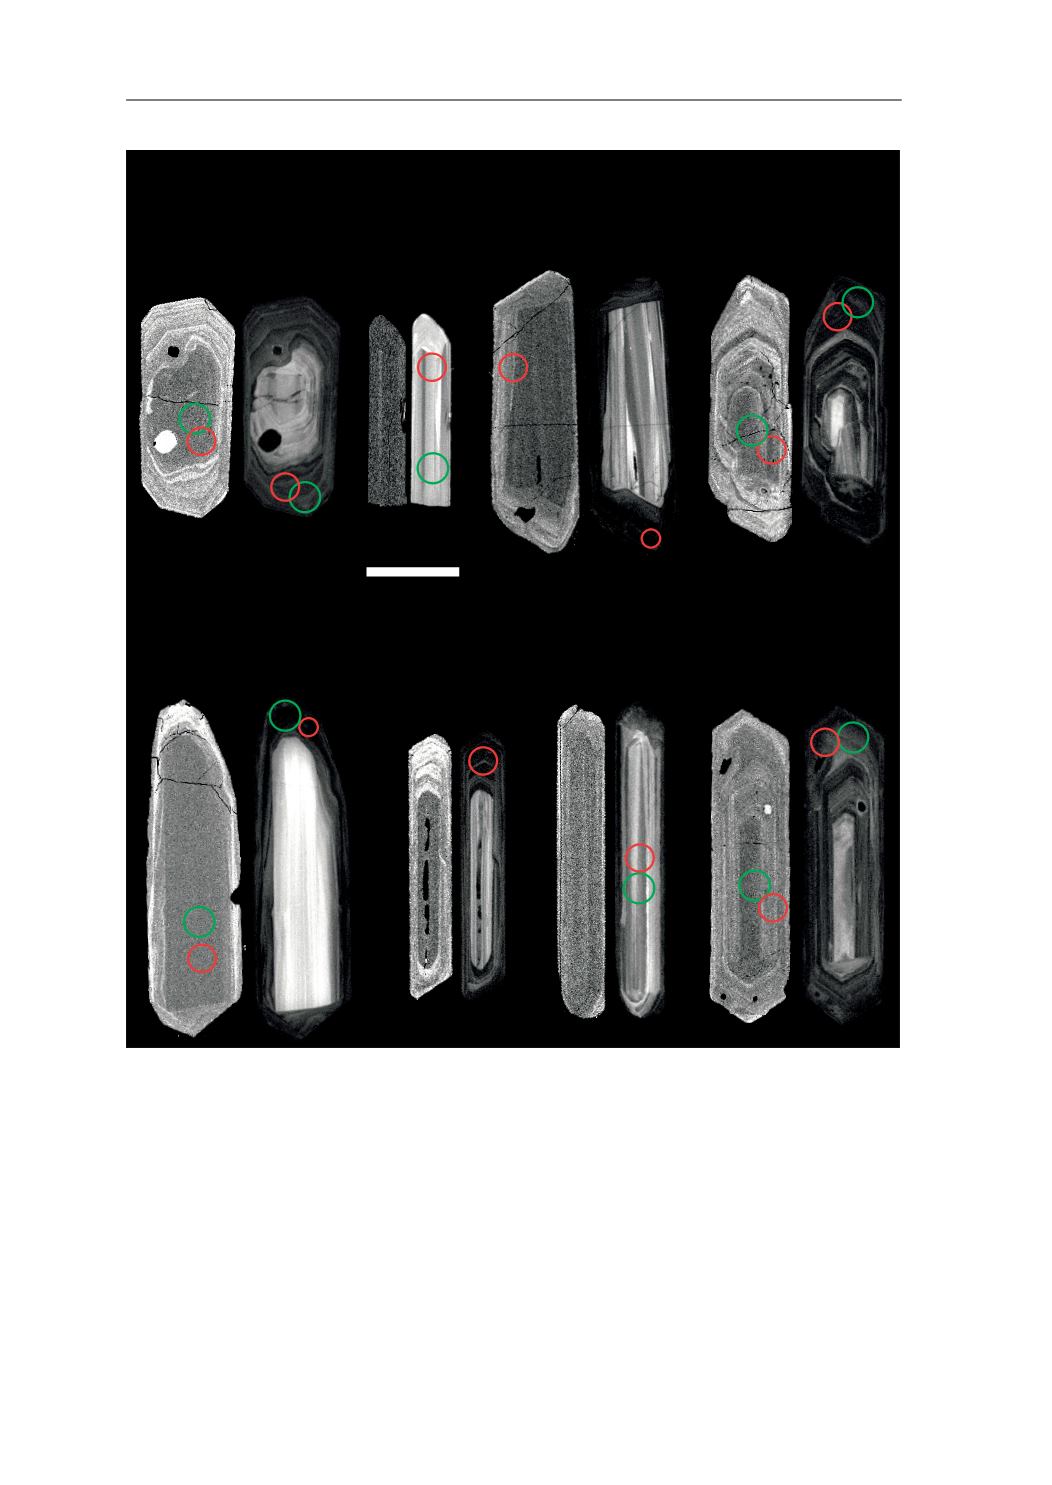
Fig. 89.
BSE and CL images of representative zircons from the studied sample. Left images circles are BSE (back-scattered
electrons) images, and right imeges are CL (cathodoluminescence) images. Laser ablation pits for U–Pb analyses (red
line circles) have 20 and 30
μ
m diameters. Laser ablation pits for Lu–Hf analyses (green line circles) have 23 and 33
μ
m
diameters. White numbers are the reference number of the analysis, red numbers are the U–Pb age and its 2
σ
error (Ma)
and the green numbers are the
H
Hf values for the U–Pb age. U–Pb analysis of A216 gave a discordant age, and
H
Hf value was
calculated for an assumed 500 Ma age.
7.4. ORTHOGNEISSES