


 207 / 352

191
If the most negative value is excluded the average
value is -2.5 (minimum: -4.7, maximum: -0.1; Fig.
90a).
176
Hf/
177
Hf
(t)
ratios for all Cambrian zircon
grains analysed plot around 0.282357 ± 0.000371
r
2 SD; Fig. 90b). If the lowest value is excluded
the average value is 0.282403 ± 0.000076 (±2 SD;
Fig. 90b).
All analysed Cambrian zircon grains have an
average content of U of 262 ppm (minimum:
54, maximum: 1011) and an average value of 21
ppm of Pb (minimum: 5, maximum: 74; Appx.
4). Th/U ratios for all Cambrian zircon grains
analysed have average values of 0.45 (minimum:
0.14, maximum: 0.93; Fig. 91a).
176
Lu/
177
Hf ratios for all Cambrian zircon
grains analysed plot around 0.00165 ± 0.00117
r
2 SD; Fig. 91b).
176
Yb/
177
Hf ratios for all
Cambrian zircon grains analysed plot around
0.0486 ± 0.0356
r
2 SD; Appx. 4).
Nd whole-rock model-age is 1.36 Ga and
H
Nd
(t)
values are:
H
Nd
(t=0)
= -6.0;
H
Nd
(t=483)
= -2.1.
7.4.6.2. Discussion
Beside the inheritances, this sample has one
zircon population with ages between
c.
470 and
520 Ma, with a maximum abundance peak at 483
Ma and with two relative abundance peaks at 498
and 512 Ma. The zircon textures (Fig. 89) show
that zircon grains from this sample have cores
and rim domains, but no age constraints could
be established for each domain. The reason for
this is that cores and rims show variable ages. For
example core A198 has an age of 500 ± 8 Ma and
core A219 has an age of 480 ± 7 Ma (Fig. 89).
Rims also show this wide time span. Rim A205
has an age of 510 ± 7 Ma and rim A230 has an
age of 476 ± 8 Ma (Fig. 89). A similar situation
happens when a close look on
176
Hf/
177
Hf
(t)
ratios
or
H
Hf
(t)
values is taken for each of these two
domains. In some cases
176
Hf/
177
Hf
(t)
ratios of
a rim and a core of the same zircon crystal are
very similar, suggesting that rims were formed
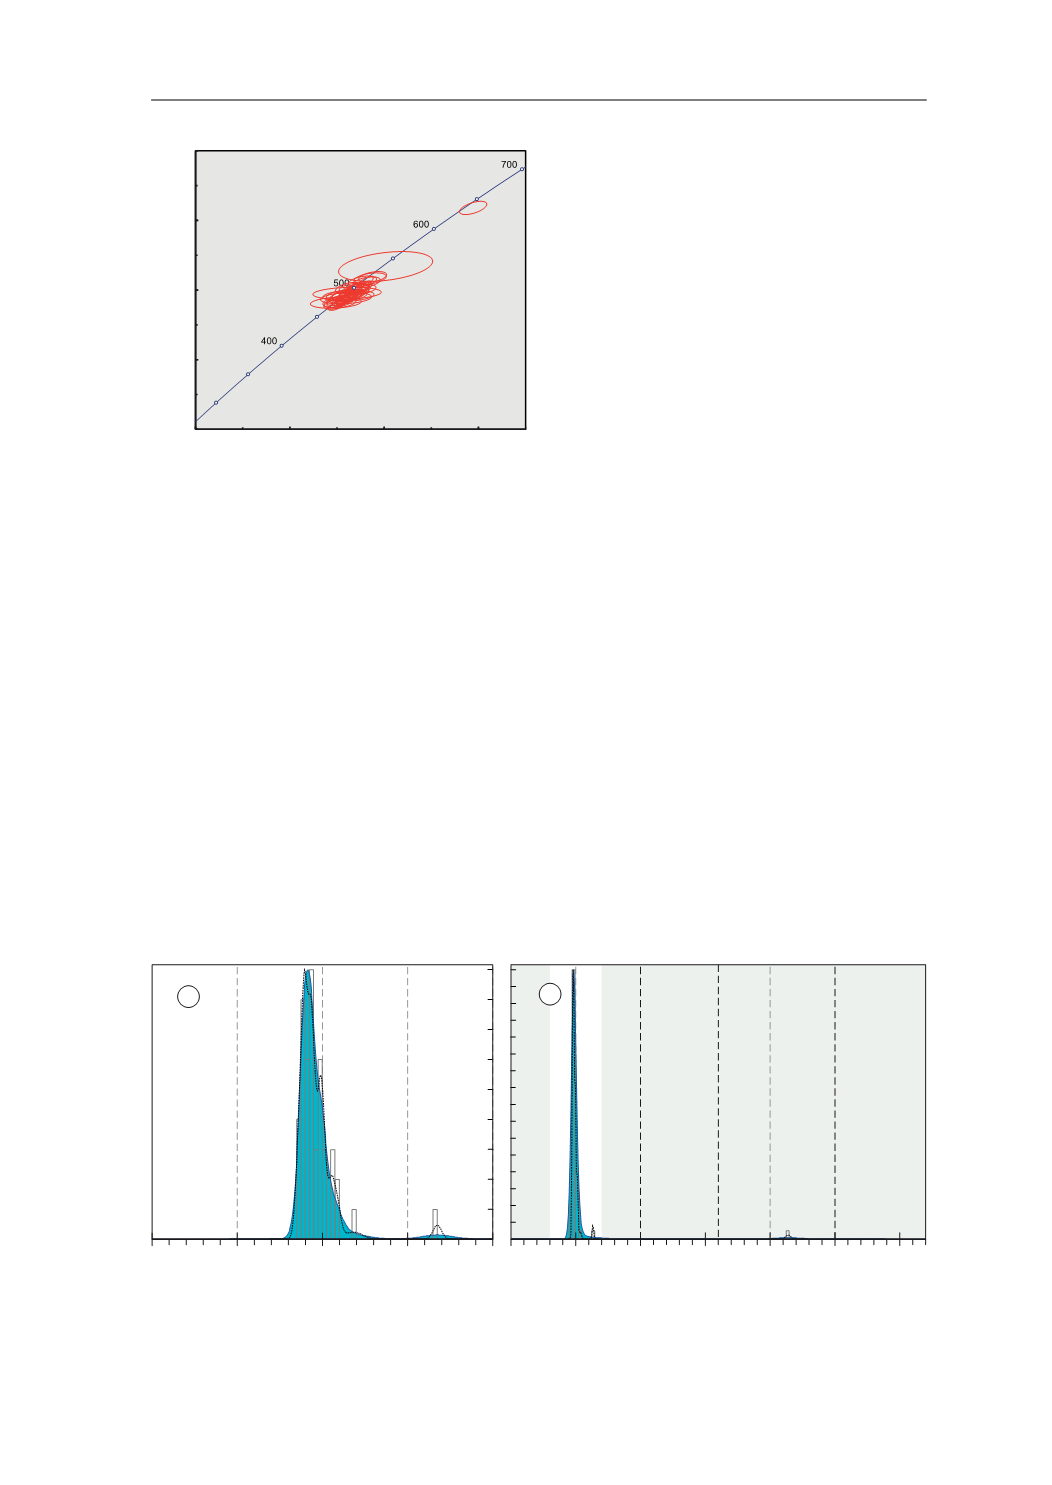
Fig. 87.
U-Pb conventional concordia diagram showing
U-Pb zircon analyses of the studied sample. Ellipses repre-
sent combined 2
σ
uncertainties of
206
Pb/
238
U and
207
Pb/
235
U
ratios.
n
, number of analyses considered (those with 90–
110% concordance)/total number of U–Pb analyses.
3E 8
GDWD SRLQW HUURU HOLSVHV DUH ı
3E 8
*&+
2UWKRJQHLVV
Q
Fig. 88.
Adaptative Kernel Density Estimation (aKDE, continuous line enclosing the blue area), Probability Density (PDP,
black dashed line) and histogram diagrams of the U–Pb analyses (calculated with DensityPlotter5.0, Vermeesch 2012).
Numbers in the vertical axis represent histogram frequency;
n
, number of analyses.
a
Partial plot representing data within
a 300–700 Ma time range (bandwidth = 5 Ma, binwidth = 5 Ma).
b
Complete plot (bandwidth = 15 Ma, binwidth = 25 Ma).
3DOHRSURWHUR]RLF
0HVR
SURWHUR]RLF
3DOHR]RLF DQG
1HRSURWHUR]RLF
$UFKHDQ
>0D@
Q
Q
D
E
7.4. ORTHOGNEISSES