


 110 / 352

5. PROVENANCE OF THE UPPER ALLOCHTHON
94
(
O'Nions et al., 1977
) to correct for mass fractionation. The LaJolla Nd
international isotopic standard was analysed during sample measure-
ment, and gave an average value of
143
Nd/
144
Nd = 0.511850 for 7
replicas, with an internal precision of ±0.00001 (2
σ
). These values
were used to correct the measured ratios for possible sample drift
following reference values from
Lugmair et al. (1983)
. The analytic
errors for
147
Sm/
144
Nd ratio is 0.1 % and for
143
Nd/
144
Nd = 0.006%.
Chondritic uniform reservoir (CHUR) present day values considered
for this study are
147
Sm/
144
Nd = 0.1967 (
Jacobsen and Wasserburg,
1980
) and
143
Nd/
144
Nd = 0.512638 (
Hamilton et al., 1983
). The DM
evolution trendand DMmodel ages (TDMs) have been calculatedas de-
scribed by
DePaolo (1981)
using
147
Sm/
144
Nd ratios and MDAs for each
sample. A
147
Sm decay constant of 6.539 × 10
−
11
a
−
1
has been used,
calculated from
147
Sm half-life reported by
Lugmair and Marti (1978)
and
Begemann et al. (2001)
. MORB epsilon values of +7 to +12 used
are those reported by
DePaolo and Wasserburg (1976)
.
5. Results
5.1. U
–
Pb results
The results of U
–
Pb dating are given as supplementary electronic
material (Suppl. Electr. Mat., Tables 1 to 6) and represented in
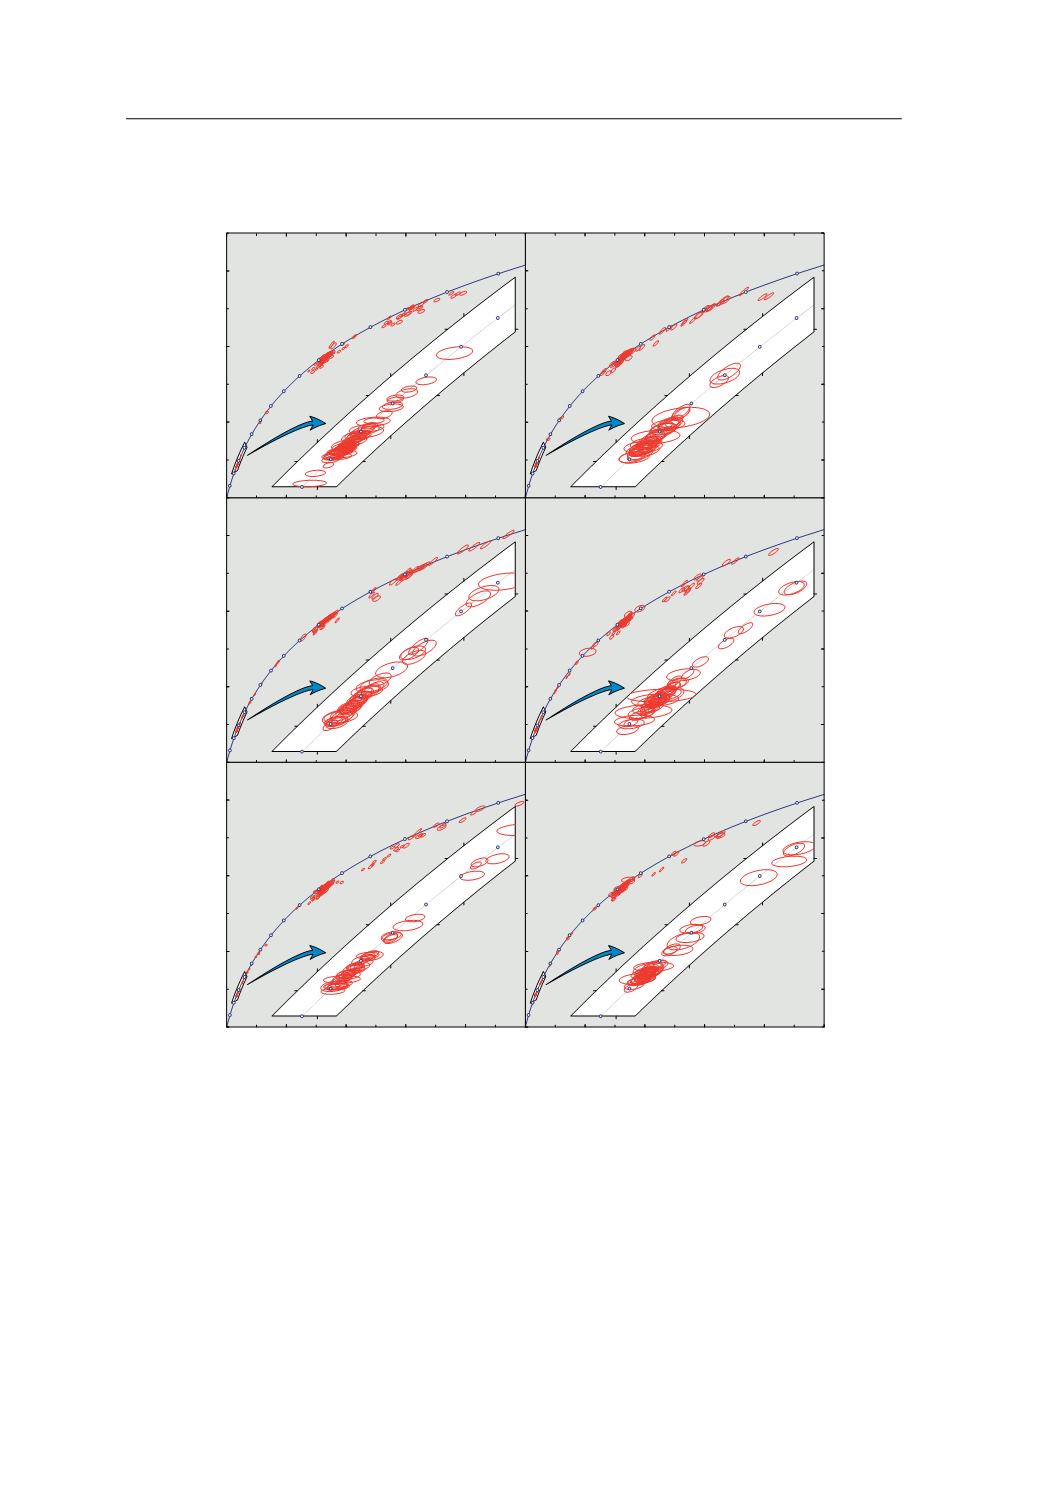
Fig. 3
.
In order to allow forward comparisons, the age spectrum has been
500
600
700
0.08
0.10
0.12
0.6
0.8
1.0
500
600
700
0.08
0.10
0.12
0.6
0.8
1.0
500
600
700
0.08
0.10
0.12
0.6
0.8
1.0
500
600
700
0.08
0.10
0.12
0.6
0.8
1.0
500
600
700
0.08
0.10
0.12
0.6
0.8
1.0
500
600
700
0.08
0.10
0.12
0.6
0.8
1.0
data-pointerror elipses are2σ
0
4
8
12
16
20
0
4
8
12
16
207
235
Pb/ U
0.0
0.2
0.4
0.6
0.0
0.2
0.4
0.6
0.0
0.2
0.4
0.6
GCH-07
n=149/166
GCH-08
n=117/122
GCH-09
n=128/131
GCH-10
n=144/154
GCH-11
n=159/168
GCH-12
n=142/148
n=63/166
n=43/12
2
n=44/131
n=52/154
n=47/168
n=45/148
207
235
Pb/ U
206
238
Pb/ U
206
238
Pb/ U
206
238
Pb/ U
1000
1400
1800
2200
2600
3000
1000
1400
1800
2200
2600
3000
1000
1400
1800
2200
2600
3000
1000
1400
1800
2200
2600
3000
1000
1400
1800
2200
2600
3000
1000
1400
1800
2200
2600
3000
Fig. 3.
U
–
Pb conventional concordia diagrams for samples GCH- 07, 08, 09, 10, 11, and 12. Ellipses represent combined 2
σ
uncertainties of
206
Pb/
238
U and
207
Pb/
235
U ratios.
1439
R. Albert et al. / Gondwana Research 28 (2015) 1434
–
1448