


 113 / 352

5. PROVENANCE OF THE UPPER ALLOCHTHON
97
two explanations for the generation of these negative
ε
Hf zircons: i) by
a mixing process between juvenile magmas and materials with strong
negative
ε
Hf values and ii) by an intense c. 500 to 560 Ma crustal
reworking process of c. 0.8
–
2.1 Ga DM derived materials. This second
explanation is not favoured owing to the very low proportion of
Mesoproterozoic zircons in the samples. The
fi
rst explanation requires
the juvenile magmas to mix with a source with an
ε
Hf
(c. 525Ma)
b
–
16
to give this wide negative range of
ε
Hf to the zircons. If we follow
the evolutionary
fi
eld array in
Fig. 8
a, this source is represented by the
c. 2.09 Ga zircons that lie on the Eburnean crust evolution trend. The
other 8 Paleozoic
–
Neoproterozoic zircons with
ε
Hf values below
–
23
lie on the Archean crust evolution
fi
eld and therefore were probably
formed by recycling Archean crust. Zircons with ages between
c. 560
–
750 Ma plot around or slightly above the CHUR evolution
trend, which is in line with an early magmatic arc setting. All
these observations are in agreement with the development of a
c. 500
–
750 Ma magmatic arc setting.
Paleoproterozoic 1.9
–
2.2 Ga zircons are arranged in a similar way as
the Paleozoic
–
Neoproterozoic zircons. Superchondritic clustered zircon
data have TDM values from c. 2.0 to 2.6 Ga (average at 2.3 Ga) and re-
semble a crust formation event where DM derived magma intrusion
started at c. 2.17 Ga, with crystallization ages concentrated at 2.09 Ga
and
fi
nished around 1.98 Ga. This timing falls within the timespan con-
sidered for the Eburnean Orogeny (c. 1.8
–
2.2 Ma;
Ennih and Liégeois,
2008
). Subchondritic zircon data have
ε
Hf values from 0 to
–
15, and
point to a mixing process between the DM derived magmas and older
rocks, probably the Archean crust.
Paleoproterozoic and Archeanzircon ages range between c. 2.24 and
3.03 Ga and have slightly positive
ε
Hf up to +4 and negative
ε
Hf down
to
–
15, with TDMs from c. 2.8 to 3.6 Ga (maximum at 3.1 Ga). These
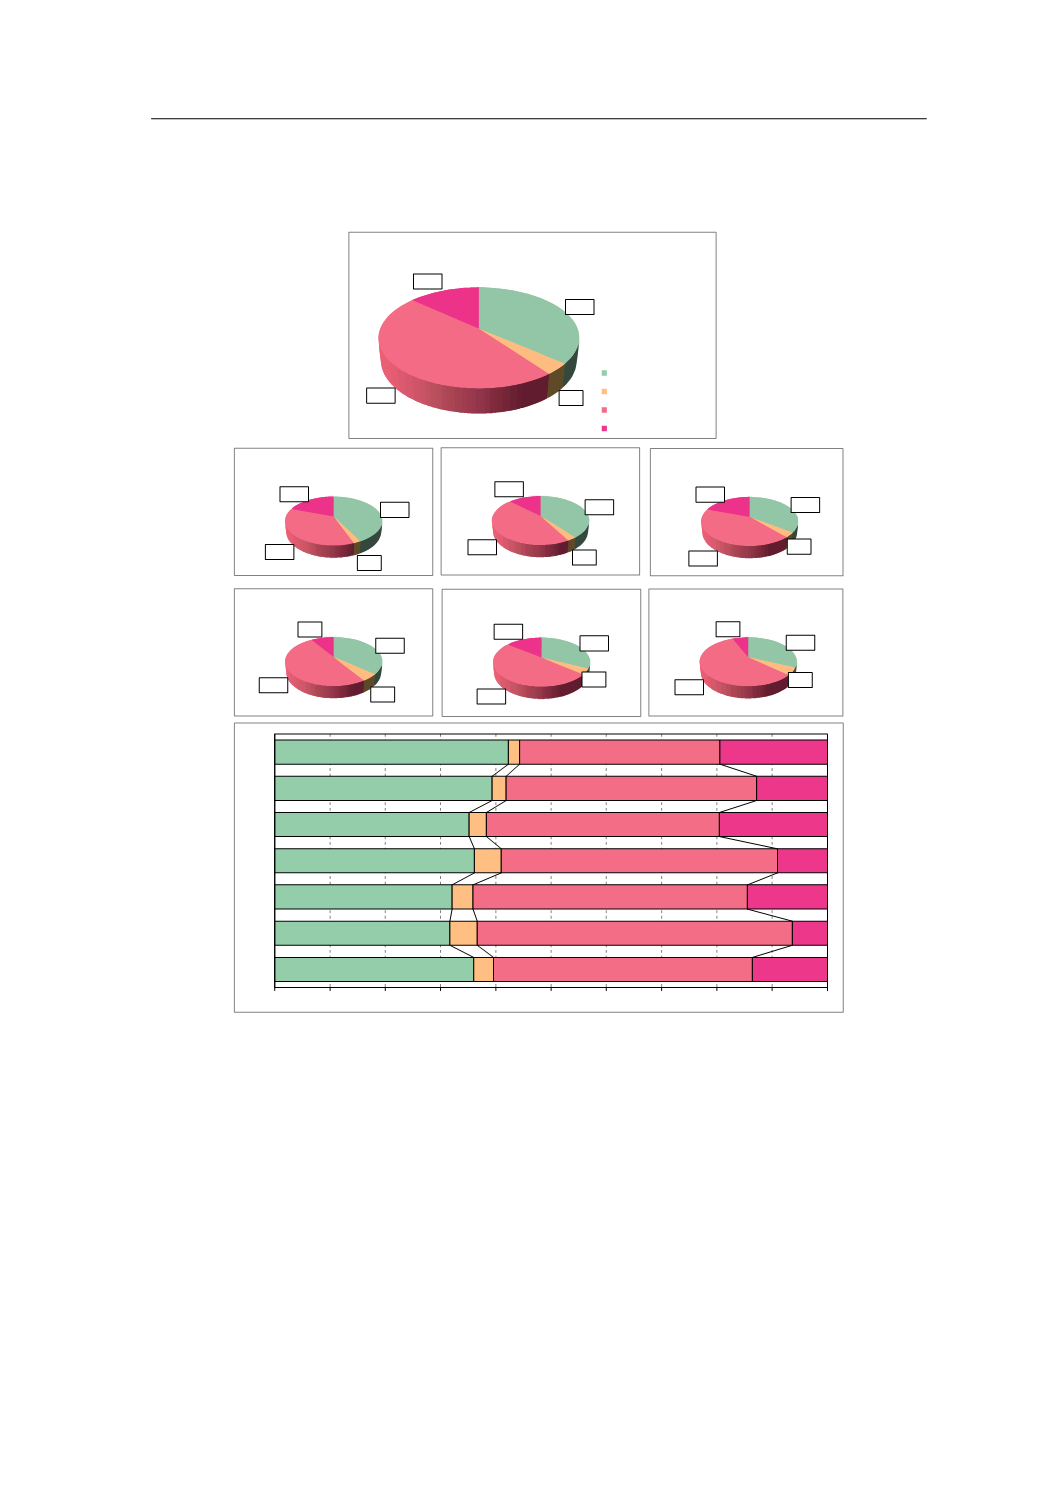
42.3
39.3
35.2
36.1
32.1
31.7
36.0
2
2.6
3.1
4.9
3.8
4.9
3.6
36.2
45.3
42.2
50.0
49.7
57.0
46.8
19.5
12.8
19.5
9.0
14.5
6.3
13.6
0%
10%
20%
30%
40%
50%
60%
70%
80%
90%
100%
GCH-07
GCH-08
GCH-09
GCH-10
GCH-11
GCH-12
Total
42.3%
2.0%
36.2%
19.5%
GCH-07
39.3%
2.6%
45.3%
12.8%
GCH-08
35.2%
3.1%
42.2%
19.5%
GCH-09
36.1%
4.9%
50.0%
9.0%
GCH-10
32.1%
3.8%
49.7%
14.5%
GCH-11
31.7%
4.9%
57.0%
6.3%
GCH-12
36.0%
3.6%
46.8%
13.6%
Total
%Paleozoic+Neoprot.
%Mesoproterozoic
%Paleoproterozoic
%Archean
Fig. 6.
Percentage of zircon populations represented as bar diagrams and circular plots.
1442
R. Albert et al. / Gondwana Research 28 (2015) 1434
–
1448