


 112 / 352

5. PROVENANCE OF THE UPPER ALLOCHTHON
96
divided in four major groups: Paleozoic
–
Neoproterozoic (
b
1 Ga),
Mesoproterozoic (1
–
1.6 Ga), Paleoproterozoic (1.6
–
2.5 Ga) and
Archean (
N
2.5 Ga; see
Fig. 6
). Descriptions of U
–
Pb results of each sam-
ple are as follows.
From sample GCH-07, 166 analyses were performed of which 149
were concordant (
b
10% discordance, d = 10.2%, d: percentage of dis-
cordant analyses). 63 of them are Paleozoic
–
Neoproterozoic (42.3%), 3
are Mesoproterozoic (2%), 54 are Paleoproterozoic (36.2%) and 29 are
Archean (19.5%). MDA
07
(GCH-07maximumdepositional age) calculat-
ed for this sample (see above) is 510.4 ± 2.4 Ma, using 12 ages.
From sample GCH-08, 122 analyses were performed of which 117
were concordant (d = 4.1%). 46 of them are Paleozoic
–
Neoproterozoic
(39.3%), 3 are Mesoproterozoic (2.6%), 53 are Paleoproterozoic (45.3%)
and 15 are Archean (12.8%), with a MDA
08
of 515.6 ± 3.8 Ma, using
15 ages.
From sample GCH-09, 131 analyses were performed of which 128
were concordant (d = 2.3%). 45 of them are Paleozoic
–
Neoproterozoic
(35.2%), 4 are Mesoproterozoic (3.1%), 54 are Paleoproterozoic (42.2%)
and 25 are Archean (19.5%), with a MDA
09
of 507.1 ± 4.2 Ma, using
10 ages.
From sample GCH-10, 154 analyses were performed of which
144 were concordant (d = 6.5%). 52 of them are Paleozoic
–
Neoproterozoic (36.1%), 7 are Mesoproterozoic (4.9%), 72 are
Paleoproterozoic (50%) and 13 are Archean (9%), with a MDA
10
of
506 ± 10 Ma, using 4 ages.
From sample GCH-11, 168 analyses were performed of which 159
were concordant (d = 5.4%). 51 of them are Paleozoic
–
Neoproterozoic
(32.1%), 6 are Mesoproterozoic (3.8%), 79 are Paleoproterozoic (49.7%)
and 23 are Archean (14.5%), with a MDA
11
of 506.3 ± 2.8 Ma, using 9
ages.
From sample GCH-12, 148 analyses were performed of which 142
were concordant (d = 4.1%). 45 of them are Paleozoic
–
Neoproterozoic
(31.7%), 7 are Mesoproterozoic (4.9%), 81 are Paleoproterozoic (57%)
and 9 are Archean (6.3%), with a MDA
12
of 509.4 ± 7.1 Ma, using 5 ages.
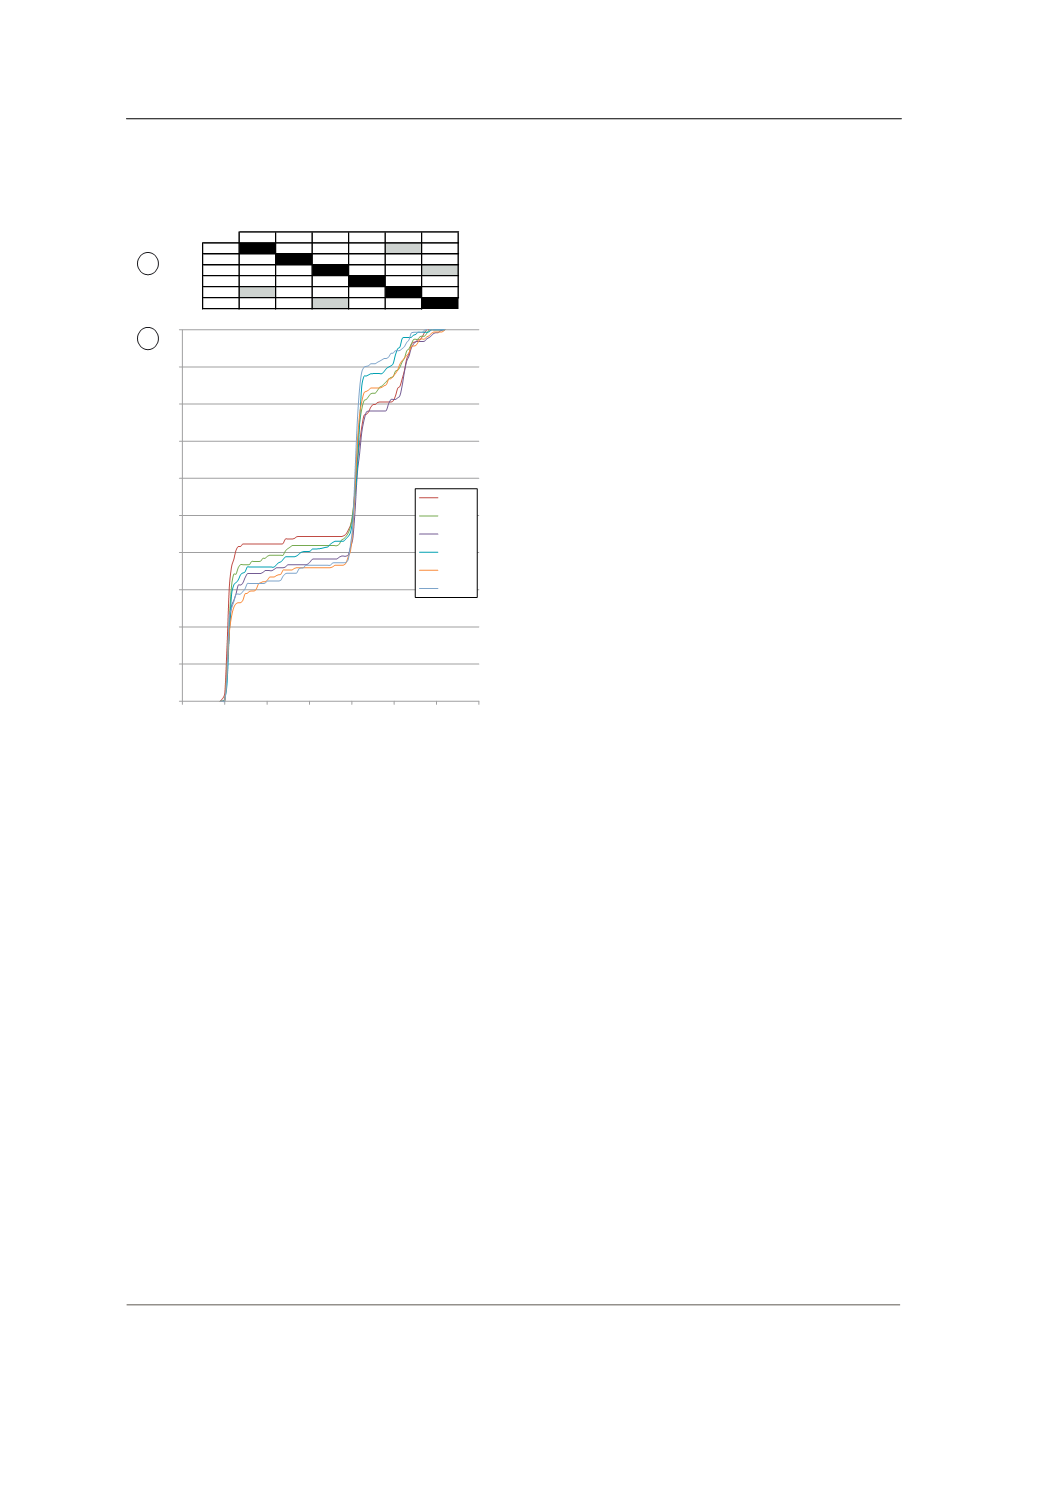
To merge all samples and treat them as a single sample a Kolmogo-
rov
–
Smirnov test has been performed.
Fig. 5
a shows its P-values and
Fig. 5
b the cumulative density function plot (CDF) which includes age
errors. P-values indicate that all six samples pass the test with the ex-
ception of GCH-07 with GCH-11 (P = 0.044) and GCH-07 with GCH-
12 (P = 0.027) comparison. Both P-values are near to 0.05 (value re-
quired to pass the test) and taking into account that the other 13 com-
parisons are satisfactory and the similarity between age distributions
observed on KDE, PDP (
Fig. 4
) and CDF plots (
Fig. 5
b), it is concluded
that all samples are shed from the same source area and that the differ-
ences between zircon age populations are explained by sampling bias
or/and because each sample is a small fraction of the same thick pile
of sediments (i.e. the same formation) located in different parts of the
stratigraphic column, and so in different positions in relation to the
source area.
Analyses from all samples are summarized in
Fig. 6
and add a
total of 889 age determinations, from which 839 have less than 10%
discordance (d = 5.6%). 36% of the analyses (n = 302) have a
Paleozoic
–
Neoproterozoic age with peaks at 505, 525, 540, 557,
590, maximum abundance at 525 Ma, and a tail with minor peaks
between 600 and 800. Mesoproterozoic ages are scattered in the
interval age of c. 1.0 to 1.5 Ga and do not de
fi
ne any maxima,
comprising 3.6% (n = 30) of the total ages. The main age group
is Paleoproterozoic (46.8%, n = 393) and it is constrained between
c. 1.98 and 2.17 Ga with a well-de
fi
ned maximum at 2.09 Ga. The
Archean population represents 13.6% (n = 114) of the analyses
with maxima at c. 2.6, 2.64 and 2.7 Ga. MDAs calculated for each sam-
ple vary from 506 to 516 Ma, with an average of 509.5 ± 3.6 Ma
(
Fig. 7
; calculated as weighted average of all six MDAs with Isoplot
software). The conservative way in which these MDAs have been
calculated guarantees with a high level of con
fi
dence that the age
of deposition is c. 510 Ma or younger.
5.2. Lu
–
Hf results
From the 839 concordant zircon cores analysed with U
–
Pb method
420 were analysed for Lu
–
Hf isotopes (Suppl. Electr. Mat., Tables 7 to
11). Around 58% of all analyses have positive
ε
Hf (
Fig. 8
a). When
these superchondritic zircon data plot near the DM evolution trend it
can be surmised that they were crystallized from magmas more or
less directly derived from a depleted mantle source.
Paleozoic
–
Neoproterozoic zircons (in particular Cambrian
–
Ediacaran) are arranged in the Hf
–
U
–
Pb age diagram in two ways
(
Fig. 8
a and b). First as positive
ε
Hf zircons (form 0 to +10 epsilon
units) with TDMs from c. 0.65 to 1.2 Ga (average at 0.9 Ga), pointing
to a high production of juvenile (depleted mantle derived) magmas be-
tween c. 500 and 560 Ma, most of them crystallizing at c. 525 Ma. This
observation is consistent with a developed magmatic arc setting. The
second way in which these zircons are arranged is with a wide range
in their
ε
Hf units, from 0 to
–
16. There is also a small cluster of 7 zircons
with
ε
Hf of
–
23 to
–
26, and a single analyses with
ε
Hf =
–
49. There are
0
0.1
0.2
0.3
0.4
0.5
0.6
0.7
0.8
0.9
1
0
500 1000 1500 2000 2500 3000 3500
Age Cumulative Probability
Age [Ma]
CDFs with error
GCH-07
GCH-08
GCH-09
GCH-10
GCH-11
GCH-12
GCH-07 GCH-08 GCH-09 GCH-10 GCH-11 GCH-12
GCH-07
0.679 0.257 0.110
0.045
0.053
GCH-08 0.679
0.791 0.902 0.467 0.496
GCH-09 0.257 0.791
0.189 0.422
0.029
GCH-10 0.110 0.902 0.189
0.773 0.202
GCH-11
0.045
0.467 0.422 0.773
0.709
GCH-12 0.053 0.496
0.029
0.202 0.709
a
b
Fig. 5.
(a)Results oftheKolmogorov
–
Smirnoff(K
–
S)test.ThisK
–
Stestcomparesthedis-
tribution of detrital zircon ages from detrital samples, and tests the null hypothesis that
the distributions are the same. When P
b
0.05 it is likely with a 95% con
fi
dence level
that the samples derive from different populations. (b) Cumulative distribution function
(CDF)plot,incorporatingmeasurementuncertainty,showingtheprobabilitythatazircon
will be younger than a certain age and the similarity between samples.
Fig. 4.
Kernel density estimation plots (continuous line enclosing the blue area) and probability density plots (dashed line) for all samples and for the combination of all Cariño Gneiss
zircons studied.
1441
R. Albert et al. / Gondwana Research 28 (2015) 1434
–
1448