


 160 / 352

144
badly defined or even structure-less. The domain
II rims are the outer features observed and define
the crystals outer habit, which normally show
well defined crystal faces and the long crystal
axis to be between two and four times longer
than the short axis (Fig. 19).
Domain II
H
Hf
(t)
values are between
c.
-3.5 and
+3.1 (average: +0.8; Fig. 20a). Domain I
H
Hf
(t)
values are between
c.
-8.8 and +3.9 (average: 0.0;
Fig. 20a).
176
Hf/
177
Hf
(t)
ratios for domain II zircon
plot around 0.282559 ± 0.000098 (±2 SD; Fig.
20b), and
176
Hf/
177
Hf
(t)
ratios for domain I zircon
plot at 0.282473 ± 0.000233 (±2 SD; Fig. 20b).
U content of domain II analysed zircon is
highly variable, in the range of 98–2783 ppm
(average: 585 ppm). U content of domain I
analysed zircon is also highly variable, in the
range of 45–1770 ppm (average: 397 ppm; Appx.
4). Domain II Th/U ratios are always below 0.2,
and vary from 0.002 to
c.
0.034 (average: 0.011),
and domain I Th/U ratios are higher and more
variable, from
c.
0.01 to
c.
1.09 (average: 0.42;
Fig. 21a).
176
Lu/
177
Hf ratios of domain II zircon are low
and vary from
c.
0.00002 to 0.00035 (average:
0.00007; Fig. 21b).
176
Lu/
177
Hf ratios of domain
I zircon are higher than those of domain II,
and vary from
c.
0.00057 to 0.00193 (average:
0.00118; Fig. 21b).
176
Yb/
177
Hf ratios of domain II
zircon are low and vary from
c.
0.0006 to 0.0139
(average: 0.0024; Appx. 4).
176
Yb/
177
Hf ratios of
domain I zircon are higher than those of domain
II, and vary from
c.
0.0162 to 0.0551 (average:
0.0349; Appx. 4).
Nd whole-rock model-age is 1.52 Ga and
H
Nd
(t)
values are:
H
Nd
(t=0)
= -2.9;
H
Nd
(t=394)
= -1.0.
7.2.3.2. Discussion
U–Pb ages can be sub-divided into three
groups, the old inheritances, Cambrian–
Ordovician domain I zircon and Devonian
domain II zircon. The younger population in this
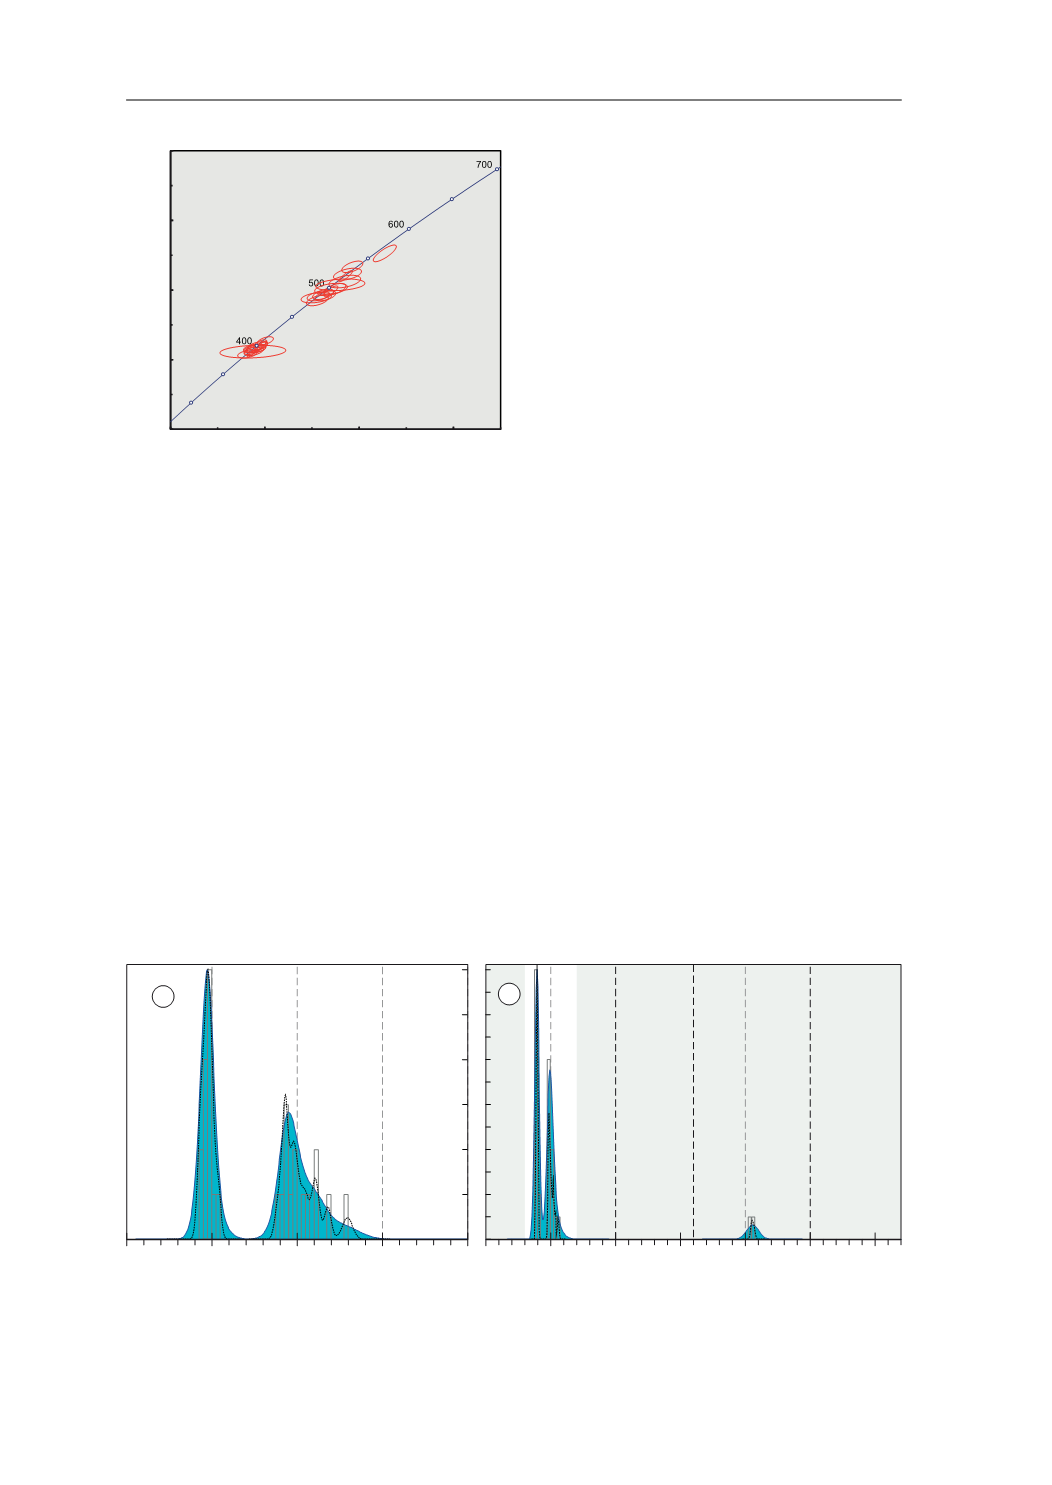
Fig. 17.
U-Pb conventional concordia diagram showing
U-Pb zircon analyses of the studied sample. Ellipses repre-
sent combined 2
σ
uncertainties of
206
Pb/
238
U and
207
Pb/
235
U
ratios.
n
, number of analyses considered (those with 90–
110% concordance)/total number of U–Pb analyses.
3E 8
GDWD SRLQW HUURU HOLSVHV DUH ı
3E 8
*&+
/HXFRVRPH
Q
Fig. 18.
Adaptative Kernel Density Estimation (aKDE, continuous line enclosing the blue area), Probability Density (PDP,
black dashed line) and histogram diagrams of the U–Pb analyses (calculated with DensityPlotter5.0, Vermeesch 2012).
Numbers in the vertical axis represent histogram frequency;
n
, number of analyses.
a
Partial plot representing data within
a 300–700 Ma time range (bandwidth = 5 Ma, binwidth = 5 Ma).
b
Complete plot (bandwidth = 15 Ma, binwidth = 25 Ma).
3DOHRSURWHUR]RLF
0HVR
SURWHUR]RLF
3DOHR]RLF DQG
1HRSURWHUR]RLF
$UFKHDQ
>0D@
Q
Q
D
E
7.2. LEUCOSOMES