


 161 / 352

145
sample, domain II, has similar
176
Hf/
177
Hf
(t)
ratios
within error than domain I zircon (Fig. 20b),
but their
176
Hf/
177
Hf
(t)
ratio variations are very
high. This high variation points to solid-state
recrystallisation for the generation of domain II
zircon, because if this zircon grew from a fluid
phase they would have the same
176
Hf/
177
Hf
(t)
ratios, heritage of the assumed chemically-
homogenised fluid phase. As this sample is a
leucosomeandafluidphaseisintrinsicallypresent
at its formation, a close look into the zircon of this
sample becomes necessary. For example, zircon
A099 and its rim A100 (Fig. 19) is a clear case
of rim overgrowth, as their
176
Hf/
177
Hf
(t)
ratios
are clearly different (0.281308 and 0.282493
respectively). On the other hand, zircon A130
and its rimA131 (0.282515, 0.282574) and zircon
A085 and its rim A086 (0.282584, 0.282558; Fig.
19) show almost identical
176
Hf/
177
Hf
(t)
ratios
and therefore a solid-state recrystallisation is
the most probable process for the formation
of the rims. The three zircon grains with lower
176
Hf/
177
Hf
(t)
ratios and
H
Hf
(t)
values (Fig. 20a,b)
with Devonian ages (domain II) are A084, A107
andA118 (Fig. 19).These three zircon grains have
the higher U contents (428, 2376 and 2783 ppm
$
ڙ
$
ڙ
$
ڙ
$
ڙ
$
1R GDWD
ڙ
$
ڙ
$
ڙ
$
ڙ
$
ڙ
$
ڙ
ȝP
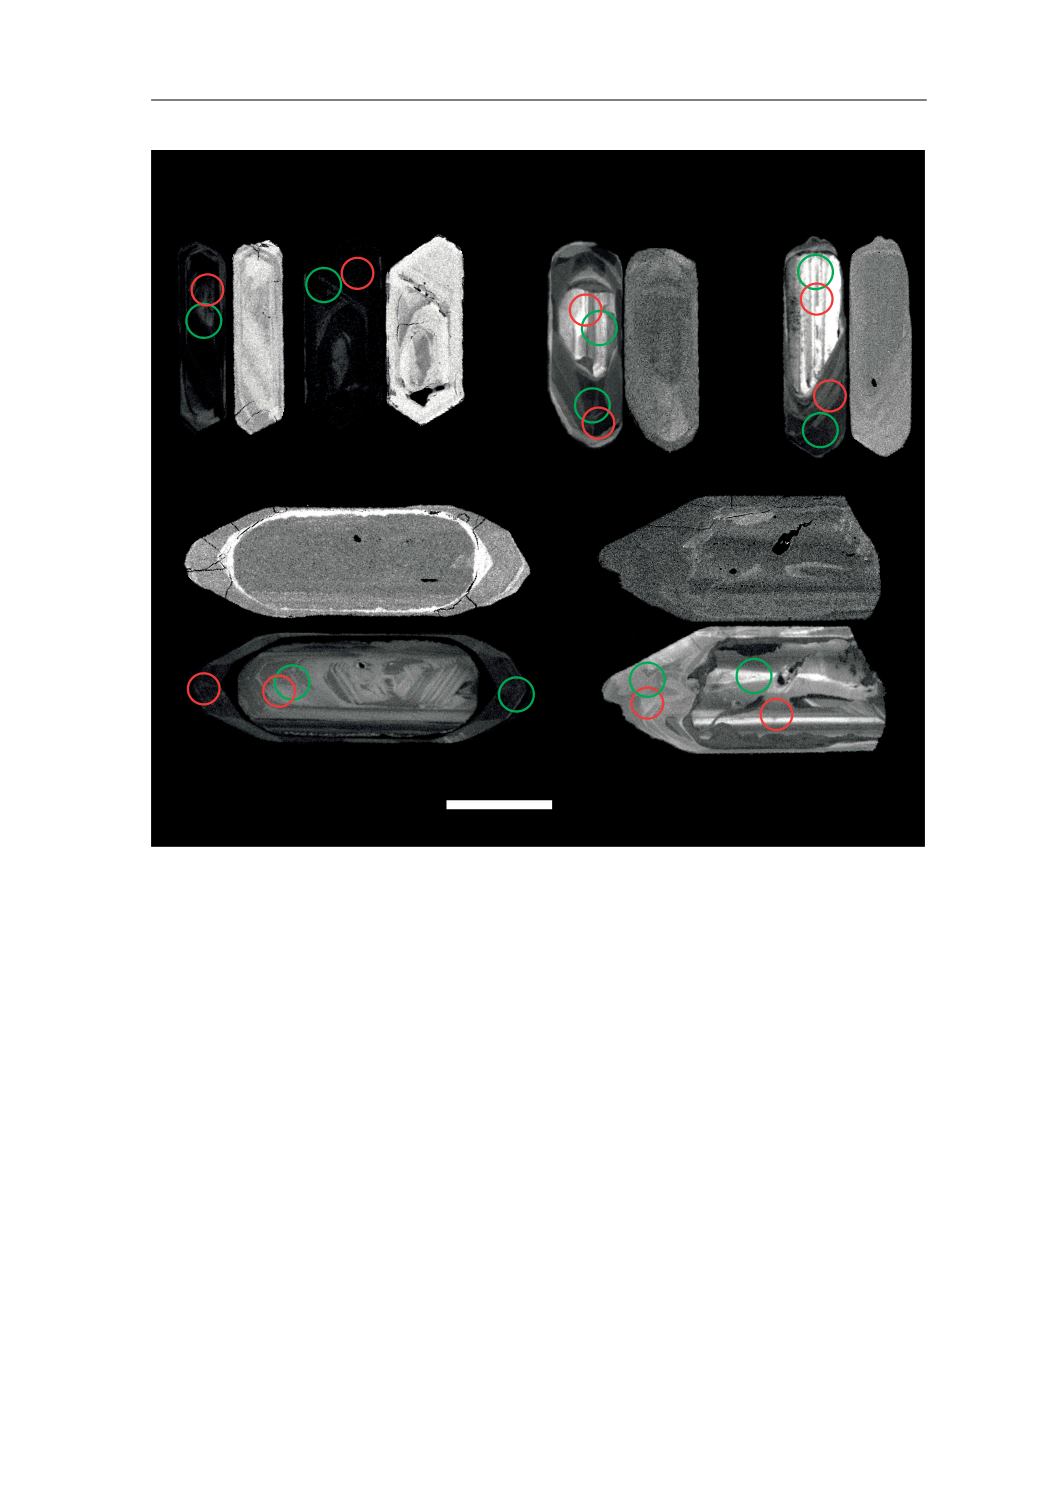
Fig. 19.
BSE and CL images of representative zircons from the studied sample. Images without circles are BSE (back-scattered
electrons) images, and those with circles are CL (cathodoluminescence) images. Laser ablation pits for U–Pb analyses (red
line circles) have 30
μ
m diameters. Laser ablation pits for Lu–Hf analyses (green line circles) have 33
μ
m diameters. White
numbers are the reference number of the analysis, red numbers are the U–Pb age and its 2
σ
error (Ma) and the green
numbers are the
H
Hf values for the U–Pb age. U–Pb analysis of A085 gave a discordant age, and
H
Hf value was calculated
for an assumed 500 Ma age.
7.2. LEUCOSOMES