


 166 / 352

150
around 0.282812 ± 0.000110 (±2 SD) and no
variation is observed between zircon grains of
different ages (Fig. 27b).
U content of the analysed zircon grains is very
low, in the range of 2–390 ppm (average: 32 ppm;
Appx. 4). Th/U ratios vary from
c.
0.002 to 0.7
and no variation is observed between zircon
grains of different ages (Fig. 28a).
176
Lu/
177
Hf ratios vary from
c.
0.0002 to 0.0013
and no variation is observed between zircon
grains of different ages (Fig. 28b).
Nd whole-rock experiments failed to calculate
a model-age, because the
147
Sm/
144
Nd ratio
calculated for this sample has a negative slope
in the
H
Nd
(t)
v.
age plot (higher value than
CHURs
147
Sm/
144
Nd value of 0.1967; Jacobsen &
Wasserburg, 1980). Epsilon value for present day
is:
H
Nd
(t=0)
= +11.9.
7.3.1.2. Discussion
U–Pb analyses are scattered but seem to be
grouped in at least three sub-subdivisions with
relative abundances at 505–485, 443–424 and
402–387Ma (Figs. 24&25a,b).The older ages (
i.e.
505–485 Ma) are assumed to date the protolith
magmatic crystallisation. Zircon with these
ages always shows a more or less well-defined
oscillatory igneous zoning, but this texture is also
displayed by zircon grains with younger ages. The
sub-division of zircon with ages of
c.
443–424 Ma
show well defined but also blurred oscillatory
zonings, and also structure-less zonings. In some
cases the structure-less zonings show diffusion
patterns which are probably due to Pb-loss
processes. The younger sub-division (
c.
402–
387) also show both type of zonings (oscillatory
and structure-less) but in most of the cases they
are structure-less or highly blurred oscillatory
zonings. Rims are also found and show fainted
oscillatory and structure-less zonings, but no
alteration fronts are evident between the rims
and the cores. Form petrological observations
(absence of alteration fronts) and geochemical
Fig. 24.
U-Pb conventional concordia diagram showing
U-Pb zircon analyses of the studied sample. Ellipses repre-
sent combined 2
σ
uncertainties of
206
Pb/
238
U and
207
Pb/
235
U
ratios.
n
, number of analyses considered (those with 90–
110% concordance)/total number of U–Pb analyses.
3E 8
GDWD SRLQW HUURU HOLSVHV DUH ı
3E 8
*&+
(FORJLWH
Q
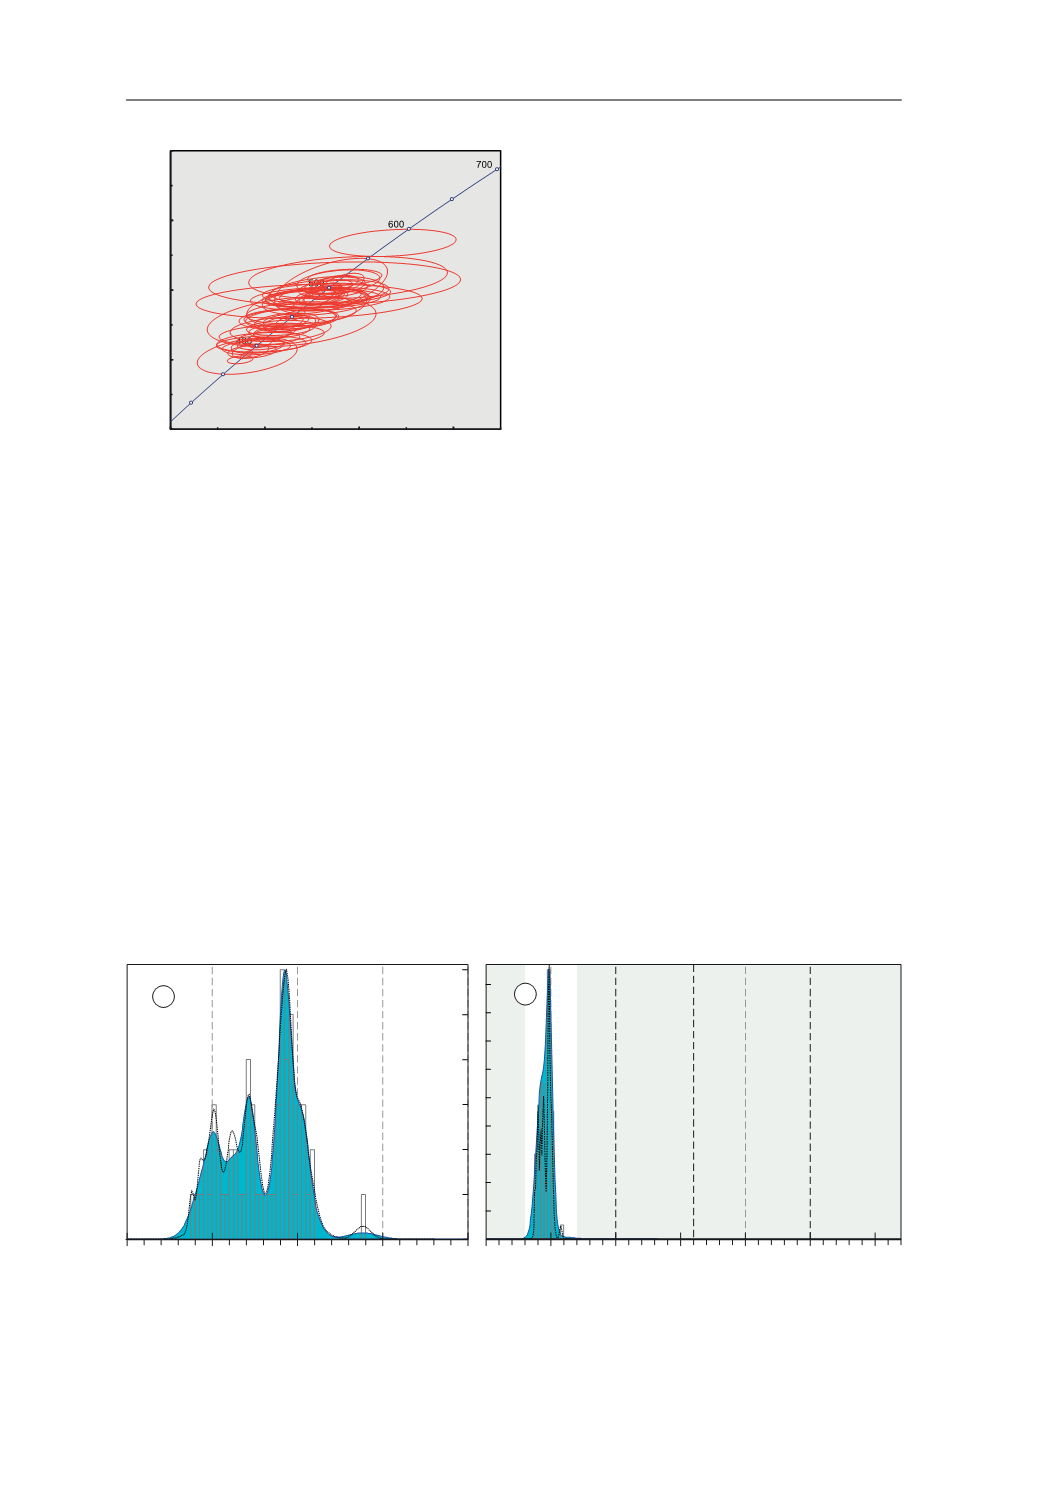
Fig. 25.
Adaptative Kernel Density Estimation (aKDE, continuous line enclosing the blue area), Probability Density (PDP,
black dashed line) and histogram diagrams of the U–Pb analyses (calculated with DensityPlotter5.0, Vermeesch 2012).
Numbers in the vertical axis represent histogram frequency;
n
, number of analyses.
a
Partial plot representing data within
a 300–700 Ma time range (bandwidth = 5 Ma, binwidth = 5 Ma).
b
Complete plot (bandwidth = 15 Ma, binwidth = 25 Ma).
3DOHRSURWHUR]RLF
0HVR
SURWHUR]RLF
3DOHR]RLF DQG
1HRSURWHUR]RLF
$UFKHDQ
>0D@
Q
Q
D
E
7.3. ECLOGITES