


 199 / 352

183
and an average of 21 ppm of Pb (minimum:
2, maximum: 103; Appx. 4). Th/U ratios have
average values of 0.34 (minimum: 0.001,
maximum: 0.94; Fig. 77a).
176
Lu/
177
Hf ratios plot around 0.00141 ±
0.00128
r
2 SD; Fig. 77b).
176
Yb/
177
Hf ratios plot
around 0.0446 ± 0.0420
r
2 SD; Appx. 4).
Nd whole-rock model-age is 1.08 Ga and
H
Nd
(t)
values are:
H
Nd
(t=0)
= -3.6;
H
Nd
(t=500)
= +0.6.
7.4.4.2. Discussion
Zircon from this sample shows a high variety
of textures and chemical ratios and values. It has
not beenpossible to relate these observations with
certain age ranges. The maximum abundance
peak of 500Ma is interpreted as the age of igneous
crystallisation of the protolithic felsic magmas.
The relative abundance peak of 470 Ma zircon
is interpreted as a Pb-loss process triggered by
the
c.
390 Ma HP–HT metamorphic event or
by a
c.
470 Ma metamorphic event that altered
the previous protolithic
c.
500 Ma zircon. This
possible
c.
470 Ma event could be a temperature
input related to the arc development in which
this sample is related to. Almost all zircon grains
show structure-less bright rims which in some
cases are sinuous and transgressive. One analysis
on a bright rim gave an age of 390
r
8 Ma (A236;
Fig. 75). This age is repeatedly present in many
samples and it is interpreted as the age of HP–
HT Devonian metamorphism and could explain,
by Pb-loss process, the relative abundance of
470 Ma zircon in this sample. This felsic rock
outcrops together with a
c.
507 Ma mafic rock
(GCH-23, section 7.3.4) and both lithologies
outcrop together with field relationships
interpreted as a mingling process between them.
It is interpreted that this felsic rock intruded at
c.
500 Ma the
c.
507 Ma mafic rock and triggered
a high temperature input. Sample GCH-23 also
shows a relative abundance of ages at
c.
470 Ma
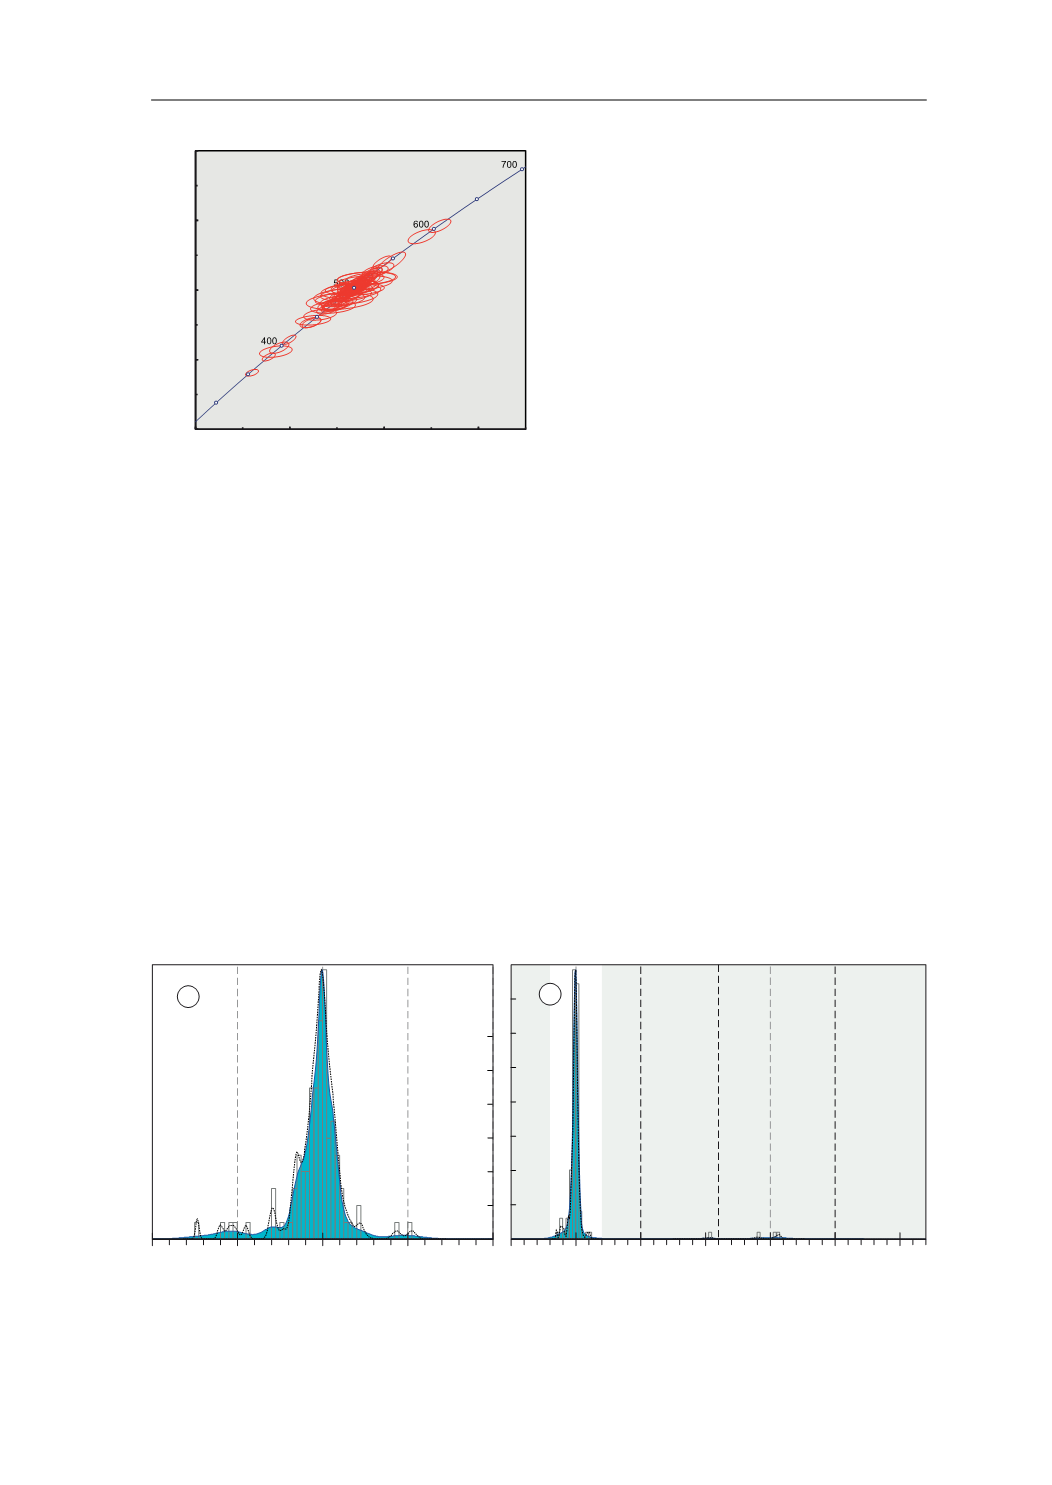
Fig. 73.
U-Pb conventional concordia diagram showing
U-Pb zircon analyses of the studied sample. Ellipses repre-
sent combined 2
σ
uncertainties of
206
Pb/
238
U and
207
Pb/
235
U
ratios.
n
, number of analyses considered (those with 90–
110% concordance)/total number of U–Pb analyses.
3E 8
GDWD SRLQW HUURU HOLSVHV DUH ı
3E 8
*&+
2UWKRJQHLVV
Q
Fig. 74.
Adaptative Kernel Density Estimation (aKDE, continuous line enclosing the blue area), Probability Density (PDP,
black dashed line) and histogram diagrams of the U–Pb analyses (calculated with DensityPlotter5.0, Vermeesch 2012).
Numbers in the vertical axis represent histogram frequency;
n
, number of analyses.
a
Partial plot representing data within
a 300–700 Ma time range (bandwidth = 5 Ma, binwidth = 5 Ma).
b
Complete plot (bandwidth = 15 Ma, binwidth = 25 Ma).
3DOHRSURWHUR]RLF
0HVR
SURWHUR]RLF
3DOHR]RLF DQG
1HRSURWHUR]RLF
$UFKHDQ
>0D@
Q
Q
D
E
7.4. ORTHOGNEISSES