


 198 / 352

182
7.4.4. Sample GCH-14
(Da Moura orthogneiss)
This orthogneiss forms part, together with
the eclogite sample GCH-23 (section 7.3.4),
of the
Punta da Moura
mingling suite. This
sample is located in the northern part of the
Masanteo
peninsula, at
Punta da Moura
(Appx.
1; 43°43’28.6”N, 7°51’20.3”W).
This orthogneiss forms part of the
Punta
Da Moura
mingling suite (Fig. 71), and from
field observations it seems that this orthogneiss
intruded the mafic rock (eclogite GCH-23,
section 7.3.4).
This sample is a fine to medium grained rock
with porphyro-grano-lepidoblastic texture (Ref:
112986). Its major constituents are Grt and Qz
and its minor constituents are Bt, Amp, Zo, Czo,
Afs, Pl, white mica, Ap, Rt, Spn and Opq (Fig.
72). Grt is strongly xenoblastic due to corrosion
and mineral replacements. It is light pink,
poikilitic, with some inclusions of Qz, Spn and
Bt, and sometimes shows an atoll texture. Qz is
displayed as non-poikilitic aggregates defining a
granoblastic interlobate to amoeboid texture. Bt
is not oriented and Zo is mainly replaced to Czo.
Czo is relatively big (up to 0.5
c
m) and always
shows rims of cryptocrystalline matter. Amp, Rt,
Spn and white mica are very small and scarce.
7.4.4.1. Results
From this sample (GCH-14), 108 U–Pb
analyses were performed of which 104 were
concordant (
d
= 3.7%; Figs. 73 & 74). The U–Pb
ages show a maximum abundance peak at 500
Ma and a relative abundance peak at 470 Ma
(Fig. 74). One analysis gave an age of 353 Ma and
4 analyses gave ages between 380 and 410 Ma.
Zircon fromthis sample shows awide variety of
textures. Some of the zircon grains show more or
less well defined oscillatory growth patterns (
e.g.
A180; Fig. 75), others show sinuous oscillatory
patterns (
e.g.
A199; Fig. 75) and others faded
oscillatory or even structure-less textures (
e.g.
A201, A206, A214; Fig. 75). Almost all zircon
grains show structure-less bright rims which in
some cases are sinuous and transgressive (
e.g.
A185; Fig. 75). No internal features are observed
in BSE images, with the exception of a low
number of inclusions.
H
Hf
(t)
values for all zircon grains are positive
with an average value of +0.1 (minimum: -4.7,
maximum: +6.9; Fig. 76a).
176
Hf/
177
Hf
(t)
ratios
plot around 0.282362 ± 0.000610 (±2 SD; Fig.
76b).
All zircon grains have an average content of
U of 223 ppm (minimum: 27, maximum: 915)
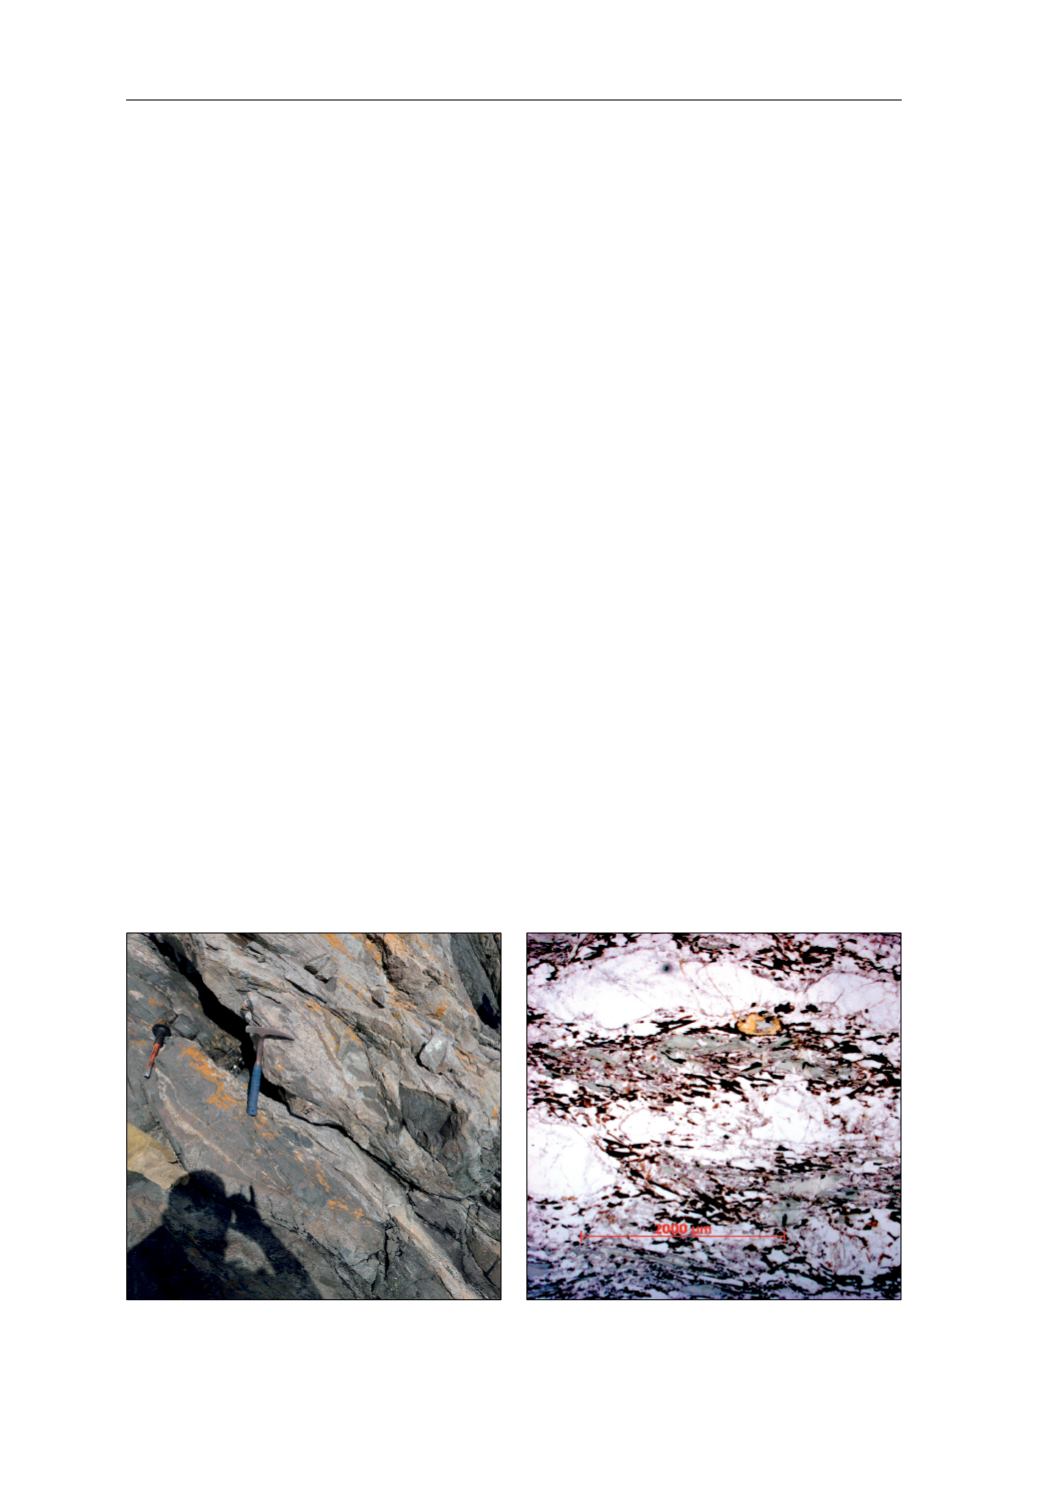
Fig. 71.
Field photograph of the studied sample. The
hammer is 33 cm long.
Fig. 72.
Phtomicrograph of the studied sample.
7.4. ORTHOGNEISSES