


 204 / 352

188
textures or in the chemical data, strongly discards
a metamorphic origin or posterior metamorphic
alteration of the zircon. The low Th/U ratios
are explained by the very high contents of U
(average: 3171 ppm). Therefore the zircon from
this sample constitutes a clear example of the
exception of typical metamorphic Th/U ratios
(< 0.02) in magmatic zircon. Even though a
metamorphic generation or overprint has been
discarded, a post-protolith event must have
taken place, because some of the zircon grains
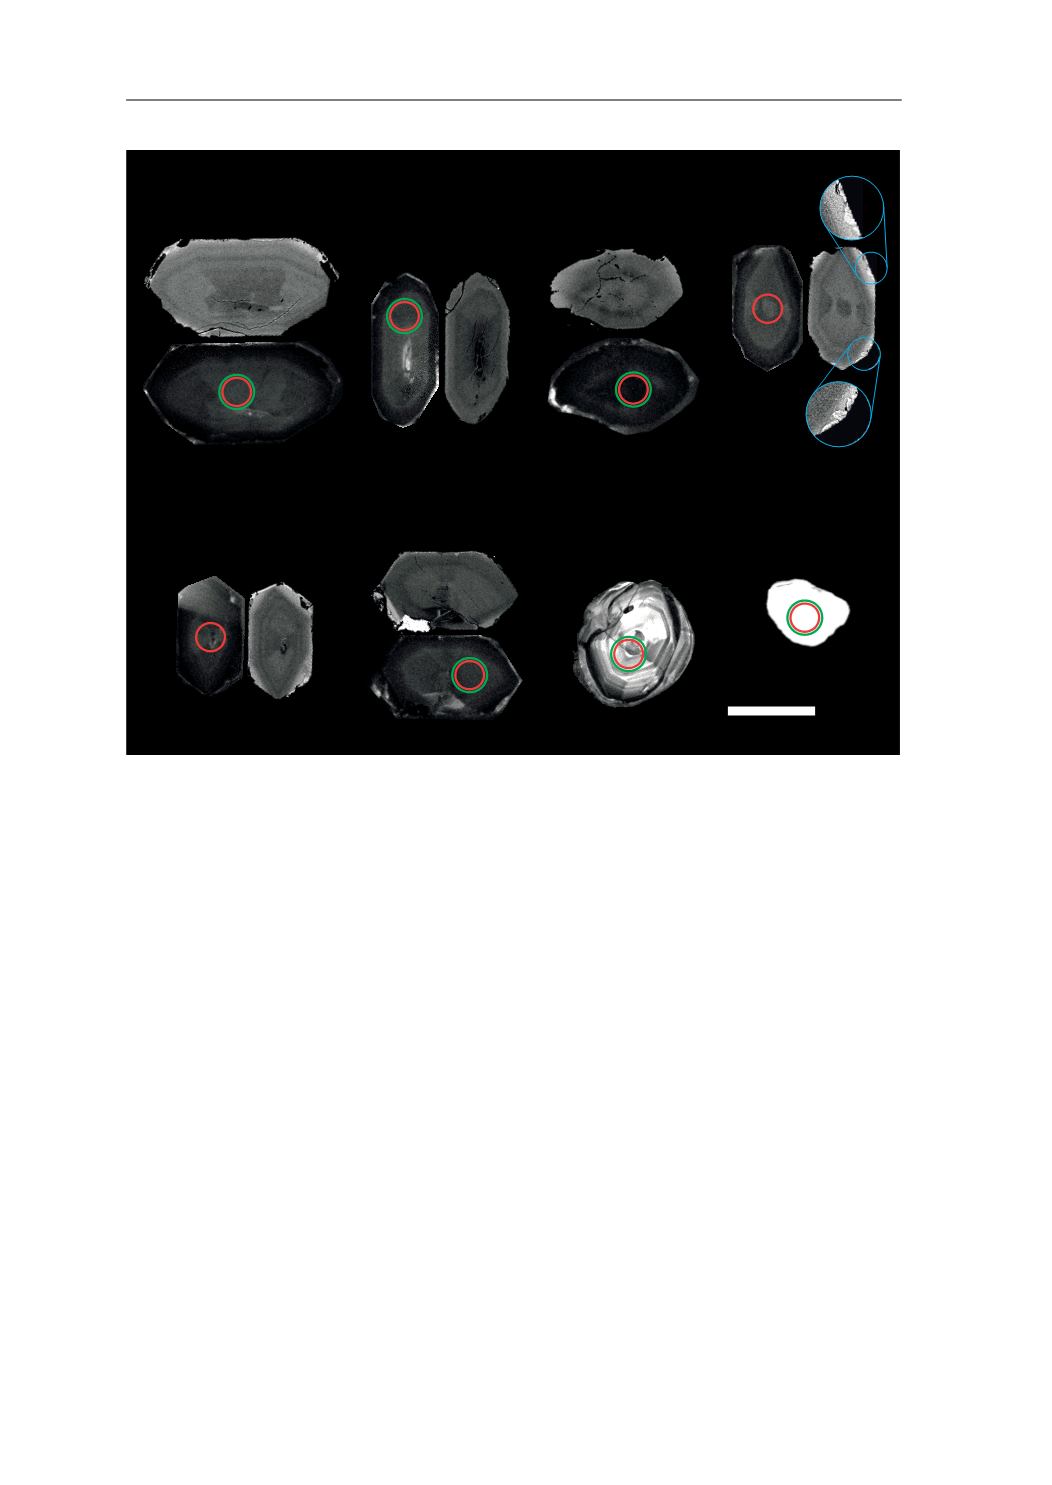
show corroded edges (
e.g.
A493; Fig. 82) and
very thin rims (see blue zoomed areas in zircon
grain A478; Fig. 82). No analytical information
could be gathered from these rims. They could
represent the only signs of over-imprint effects
of zircon from the Devonian metamorphic event
that the Upper Allochthon underwent. The low
H
Hf
(t)
values calculated (average value of -5.3;
Fig. 83a) indicates that the protolith material
was not juvenile. It could be the result of partial
melting of a
c.
1.46 Ga old juvenile rock (average
Hf zircon model-age is 1.46 Ga) or the result
of mixing of a juvenile magma and the magma
resulting from partial melting of a rock older
than 1.46 Ga. It could also be the result of partial
melting of sedimentary rocks. If this was the
case it would be expected that Nd whole-rock
model-age of this sample (Nd
TDM
= 2.32 Ga)
fell in the range of those of the Banded Gneiss
metasedimentary rocks (from 1.31 to 1.85 Ga;
see chapter 6), and they do not. Therefore it is not
possible to give a reason of why the source signal
of this rock is not juvenile, but is most probably
linked to the complex magmatic development of
the magmatic arc in which this orthogneiss was
formed.
$
ڙ
$
FRQF
ڙ
$
ڙ
$
ڙ
$
ڙ
$
$
$
ڙ
ȝP
[
[
Fig. 82.
BSE and CL images of representative zircons from the studied sample. Images without circles are BSE (back-scattered
electrons) images, and those with circles are CL (cathodoluminescence) images. Laser ablation pits for U–Pb analyses (red
line circles) have 33
μ
m diameters. Laser ablation pits for Lu–Hf analyses (green line circles) have 40
μ
m diameters. Blue
circles are zoomed areas. White numbers are the reference number of the analysis, red numbers are the U–Pb age and its 2
σ
error (Ma) and the green numbers are the
H
Hf values for the U–Pb age.
7.4. ORTHOGNEISSES