


 202 / 352

186
7.4.5. Sample GCH-18
(Area da Vaca orthogneiss, 275 m)
This sample was collected from the
Area da
Vaca
beach (43°43’30.1”N, 7°51’42.4”W), at
the 275 m point of the
Area da Vaca
geological
section (Appx. 1).
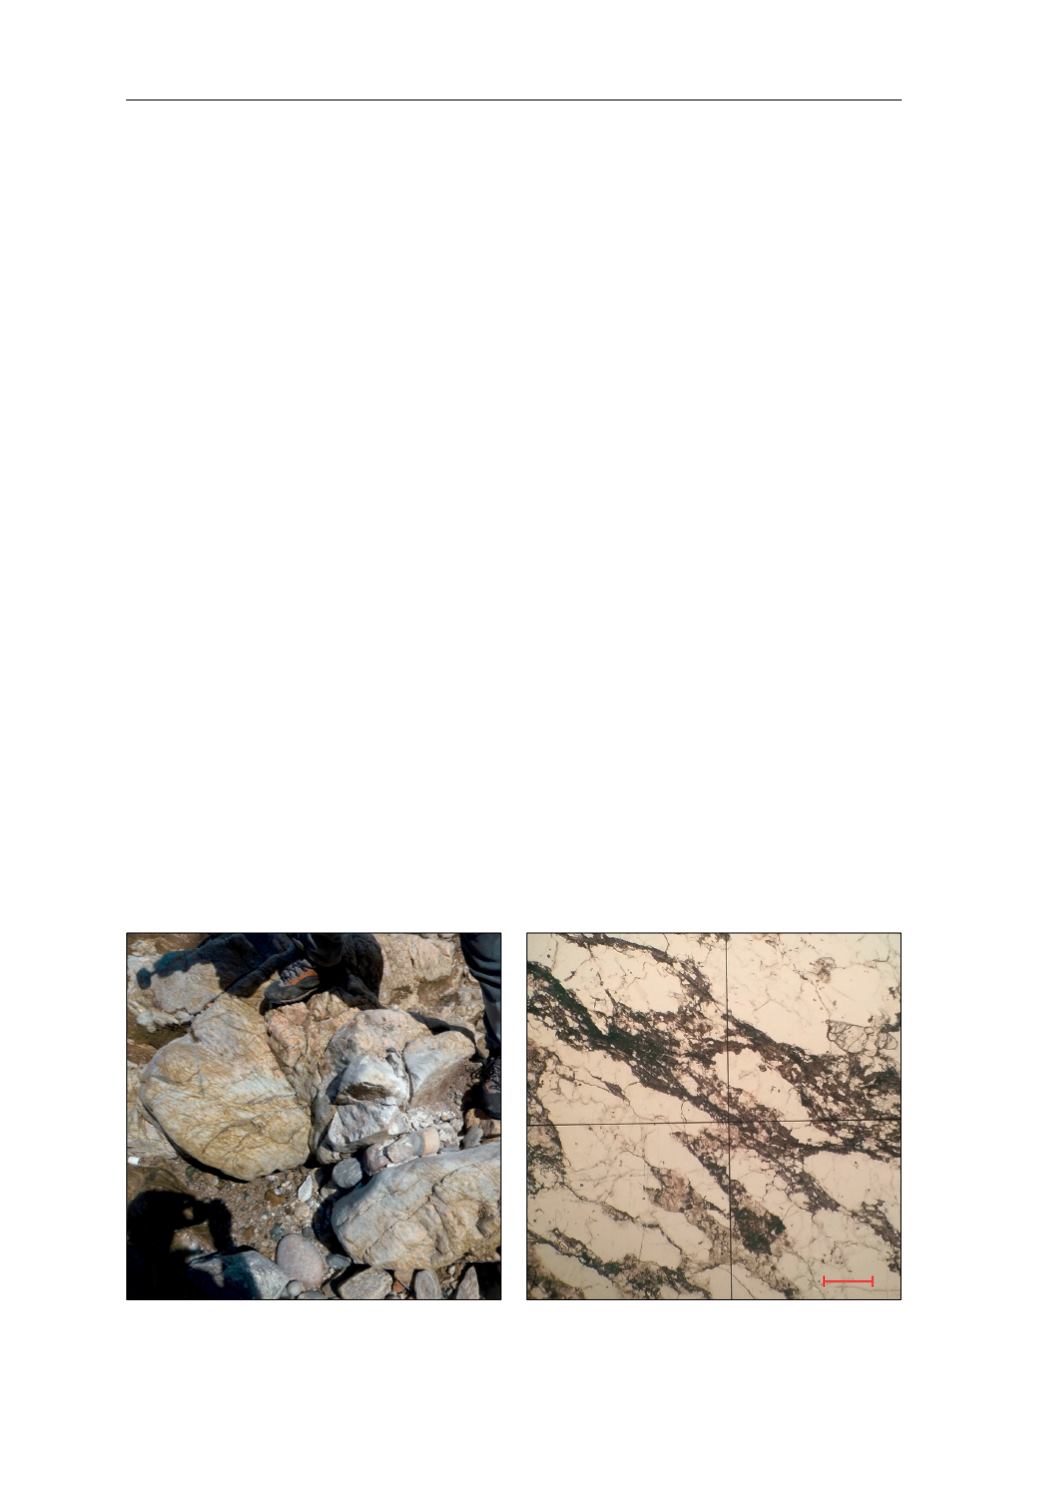
This orthogneiss outcrops as a leucocratic
felsic rock intruding the metasedimentary rocks
(Fig. 78). It outcrops at the 255 and 275 m points
of the
Area da Vaca
geological section; chapter
4).
From microscopic observations this sample
has a granoblastic texture (Ref: 112990). Qz and
Afs are the major constituents (Fig. 79). The
matrix is formed mainly by small crystals of
altered Afs and white mica (most probably Ms).
Qz is displayed as tabular elongated poly-crystals
defining the foliation. Other constituents are Ap
and Zrn. Very small transparent tabular crystals
with low interference colours were found, and
they are thought to be an Als, probably Ky. Very
small idioblastic crystals of Grt were found in
very small quantities.
7.4.5.1. Results
From this sample (GCH-18), 62U–Pb analyses
were performed of which 60 were concordant
(
d
= 3.2%; Figs. 80 & 81). The U–Pb ages are
scattered in the range of 492–524 Ma, with a
maximum abundance peak at 506 Ma (Fig. 81),
and there are also two inheritances out of which
one is concordant with an age of 1152 Ma.
All zircon grains from this sample are
idiomorphic and show combined sector and
oscillatory growth patterns (except the old
inheritances; Fig. 82). Some of the zircon grains
show bright borders in BSE images which are
probably features from the last stages of the
magmatic crystallisation (
e.g.
A478 and A469;
Fig. 82). Some zircon grains are slightly corroded
(
e.g.
A479; Fig. 82) and show very small and thin
bright rims (see details of A478; Fig. 82).
H
Hf
(t)
values for all Cambrian zircon grains
analysed are negative with an average value of
-5.3 (minimum: -6.9, maximum: -2.4; Fig. 83a).
176
Hf/
177
Hf
(t)
ratios for all Cambrian zircon grains
plot around 0.282312 ± 0.000042 (±2 SD; Fig.
83b).
All analysed zircon grains have an average
content of U of 3171 ppm (minimum: 880,
maximum: 6124) and an average value of 238
ppm of Pb (minimum: 66, maximum: 465;
Appx. 4). Th/U ratios are lower than 0.2 and
have average values of 0.005 (minimum: 0.004,
maximum: 0.006; Fig. 84a).
Fig. 78.
Field photograph of the studied sample. The boot
is
c
. 30 cm long.
Fig. 79.
Photomicrograph of the studied sample.
ȝP
7.4. ORTHOGNEISSES