


 203 / 352

187
176
Lu/
177
Hf ratios for all Cambrian analysed
zircon grains plot around 0.00138 ± 0.00062
r
2
SD; Fig. 84b).
176
Yb/
177
Hf ratios for all Cambrian
zircon grains analysed plot around 0.0433 ±
0.0190
r
2 SD; Appx. 4).
Nd whole-rock model-age is 2.32 Ga and
H
Nd
(t)
values are:
H
Nd
(t=0)
= -6.4;
H
Nd
(t=506)
= -4.4.
7.4.5.2. Discussion
Beside the inheritances this sample has one
zircon population with ages between 492 and 524
Ma and with a maximum abundance peak at 506
Ma. The textures that these zircon grains display
are sector (“soccerball”) growth patterns in the
inner parts of the crystals that progressively
changes to oscillatory zoning at their external
parts (Fig. 82). These growth patterns are
perfectly congruent with the geological setting
of the formation of this sample, which is a felsic
igneous rock whose magmatic protolith intruded
the Banded Gneiss metasedimentary rocks. The
176
Hf/
177
Hf
(t)
ratios for this Cambrian population
are very similar (0.282312 ± 0.000042; ±2 SD;
Fig. 83b), and strongly suggests that all this
zircon grew from the same homogeneous fluid
phase. All analysed Cambrian zircon grains
in this sample are concordant, within a 98–
103% degree of concordance, resembling the
very good quality of the analyses. Taking into
account this high degree of concordance and
the zircon textures, there is no evidence of Pb-
loss processes. Therefore, the 32 Ma time period
between the youngest and oldest zircon grains
probably represents the cooling time range of
the igneous protolith. This timespan seems to
be too long, but the arc environment in which
this sample is included could explain this long
cooling interval, as the arc system could provide
long-lived temperature input. The very lowTh/U
ratios (average: 0.005) can be interpreted as an
evidence of metamorphic growth of the zircon,
but the lack of signs of overgrowth or solid-
state recrystallisation (no recrystallisation zones
or alteration fronts were found) in the zircon
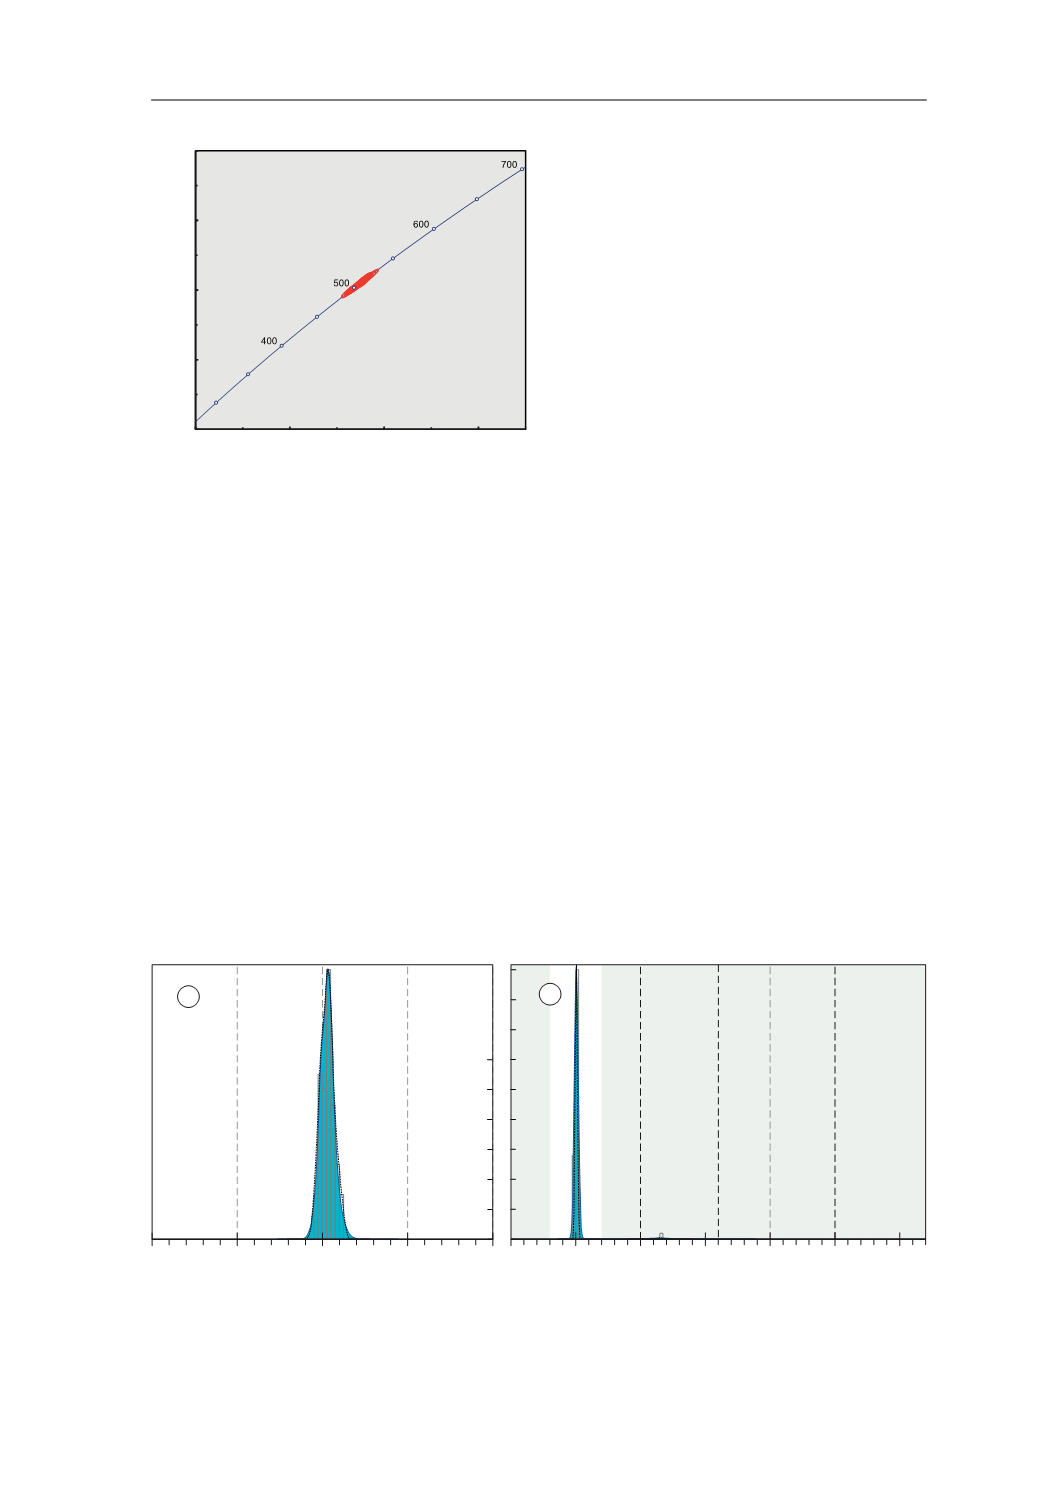
Fig. 80.
U-Pb conventional concordia diagram showing
U-Pb zircon analyses of the studied sample. Ellipses repre-
sent combined 2
σ
uncertainties of
206
Pb/
238
U and
207
Pb/
235
U
ratios.
n
, number of analyses considered (those with 90–
110% concordance)/total number of U–Pb analyses.
3E 8
GDWD SRLQW HUURU HOLSVHV DUH ı
3E 8
*&+
2UWKRJQHLVV
Q
Fig. 81.
Adaptative Kernel Density Estimation (aKDE, continuous line enclosing the blue area), Probability Density (PDP,
black dashed line) and histogram diagrams of the U–Pb analyses (calculated with DensityPlotter5.0, Vermeesch 2012).
Numbers in the vertical axis represent histogram frequency;
n
, number of analyses.
a
Partial plot representing data within
a 300–700 Ma time range (bandwidth = 5 Ma, binwidth = 5 Ma).
b
Complete plot (bandwidth = 15 Ma, binwidth = 25 Ma).
3DOHRSURWHUR]RLF
0HVR
SURWHUR]RLF
3DOHR]RLF DQG
1HRSURWHUR]RLF
$UFKHDQ
>0D@
Q
Q
D
E
7.4. ORTHOGNEISSES