


 170 / 352

154
7.3.2.1. Results
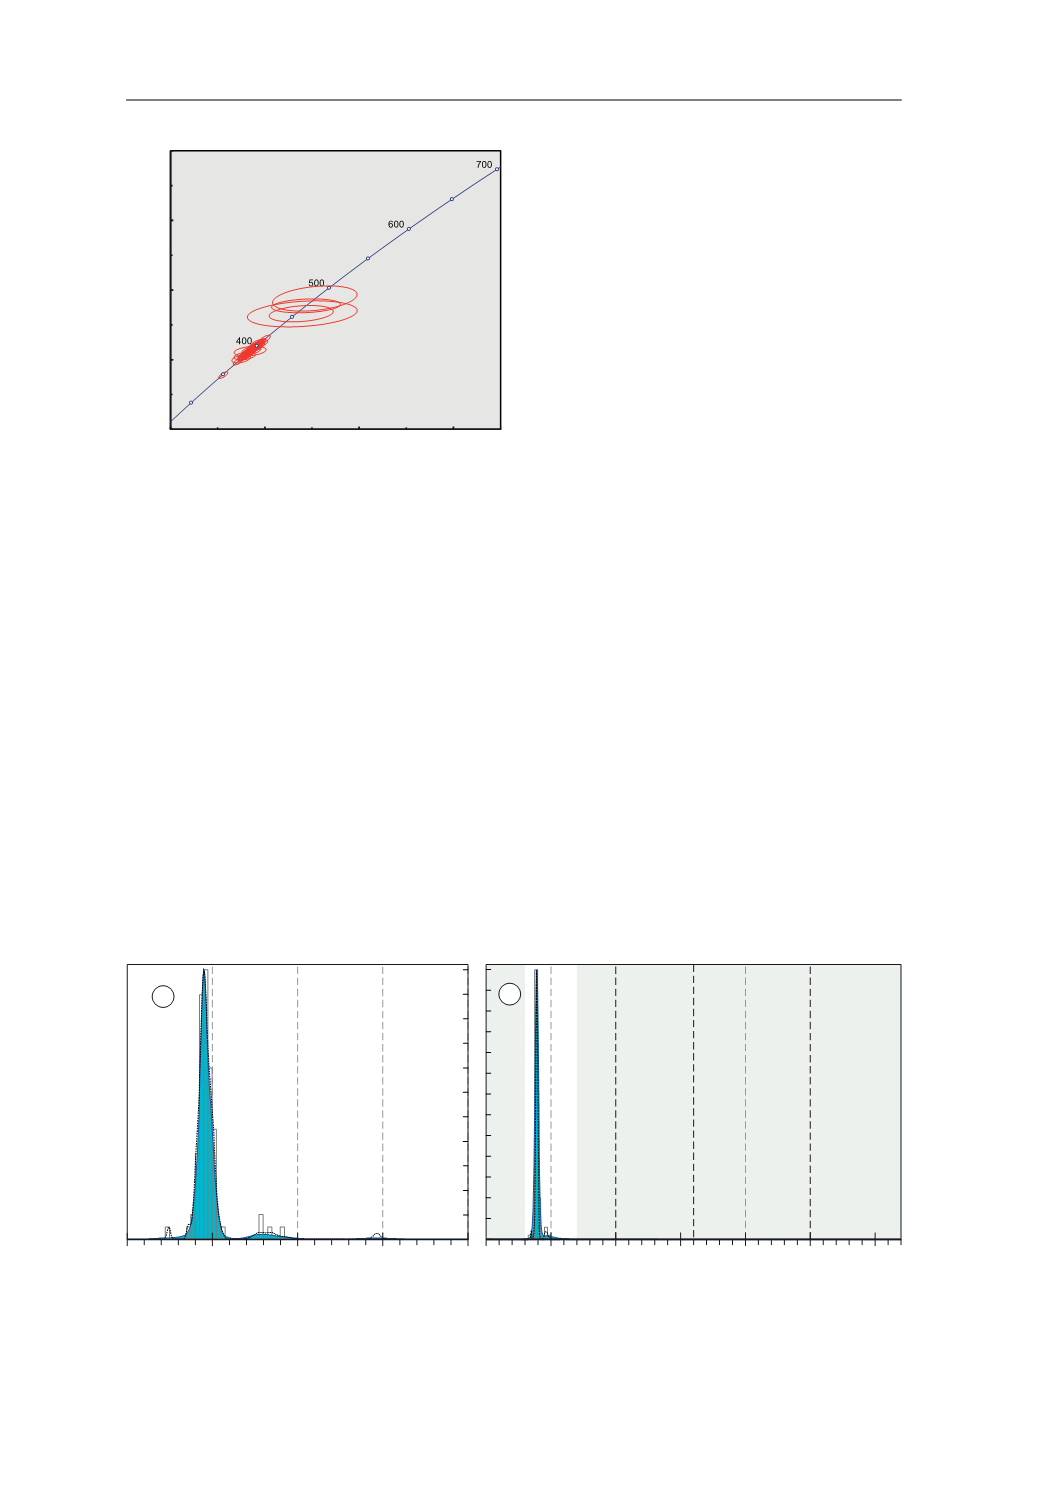
From this sample (GCH-20), 83U–Pb analyses
were performed of which 82 were concordant (
d
= 1.2%; Figs. 31 & 32). The majority of the U–Pb
ages are grouped between 372 and 410 Ma, with
a maximum abundance at 390 Ma (domain II;
Fig. 32a), and only three zircon grains (domain
I) are older than 420 Ma.
Zircon in this sample show highly blurred
and fainted dark oscillatory zonings. Most of
the textures are so blurred that they can be
considered structure-less. Some of the domain
II (390 Ma) zircon show overgrowths, that are
brighter in the CL images than their cores (they
were not analysed because they are too small,
c.
1
P
m; see Fig. 33). Other zircon grains from
this same group show structure-less inherited
cores (Fig. 33). When zircon of this sample was
hand-picked many apatites were selected. The
CL images of these apatites show that their REE
contents are extremely high, even higher than
zircon (their images are darker than the zircon
images). No internal features are observed in
BSE images.
Domain II
H
Hf
(t)
values are high and plot
around the MORB-DM evolution trend with
values between
c.
+7.7 and +12.1 (average: +10.1;
Fig. 34a). Domain I
H
Hf
(t)
values are also high
with values of +13.0, +13.1 and +14.2 (average:
+13.4; Fig. 34a).
176
Hf/
177
Hf
(t)
ratios for domain
II zircon plot around 0.282821 ± 0.000061 (±2
SD; Fig. 34b), and
176
Hf/
177
Hf
(t)
ratios for domain
I zircon plot at 0.282859 ± 0.000016 (±2 SD; Fig.
34b).
U content of domain II analysed zircon is
very low, 111–655 ppm (average: 409 ppm). U
content of domain I analysed zircon is lower than
domain II zircon, 6–27 ppm (average: 16 ppm).
Domain II Th/U ratios vary from
c.
0.0002 to
0.01. Domain I Th/U ratios are higher, from
c.
0.1 to
c.
0.8 (average: 0.25; Fig. 35a).
Fig. 31.
U-Pb conventional concordia diagram showing
U-Pb zircon analyses of the studied sample. Ellipses repre-
sent combined 2
σ
uncertainties of
206
Pb/
238
U and
207
Pb/
235
U
ratios.
n
, number of analyses considered (those with 90–
110% concordance)/total number of U–Pb analyses.
3E 8
GDWD SRLQW HUURU HOLSVHV DUH ı
3E 8
*&+
(FORJLWH
Q
Fig. 32.
Adaptative Kernel Density Estimation (aKDE, continuous line enclosing the blue area), Probability Density (PDP,
black dashed line) and histogram diagrams of the U–Pb analyses (calculated with DensityPlotter5.0, Vermeesch 2012).
Numbers in the vertical axis represent histogram frequency;
n
, number of analyses.
a
Partial plot representing data within
a 300–700 Ma time range (bandwidth = 5 Ma, binwidth = 5 Ma).
b
Complete plot (bandwidth = 15 Ma, binwidth = 25 Ma).
3DOHRSURWHUR]RLF
0HVR
SURWHUR]RLF
3DOHR]RLF DQG
1HRSURWHUR]RLF
$UFKHDQ
>0D@
Q
Q
D
E
7.3. ECLOGITES