


 171 / 352

155
176
Lu/
177
Hf ratios of domain II zircon are
extremely low and vary from
c.
0.00001 to
0.00005 (Fig. 35b).
176
Lu/
177
Hf ratios of domain
I zircon are low and vary from
c.
0.00025 to
0.00037 (Fig. 35b).
Nd whole-rock experiments failed to calculate
a model-age, because the
147
Sm/
144
Nd ratio
calculated for this sample has a negative slope
in the
H
Nd
(t)
v.
age plot (higher value than
CHURs
147
Sm/
144
Nd value of 0.1967; Jacobsen &
Wasserburg, 1980). Epsilon value for present day
is:
H
Nd
(t=0)
= +9.4.
7.3.2.2. Discussion
The majority of the U–Pb ages from this
sample are grouped at 390 Ma (domain II; Fig.
32a), and only three zircon grains (domain I)
show ages older than 420 Ma.
Domain I zircon is very scarce (
n
= 3/19; zircon
analysed with U–Pb and Lu–Hf systematics)
and seem to be the remnants of the magmatic
protolithic zircon. This assumption is favoured
by the fact that they are the older zircon grains in
the sample and that they have higher Th/U ratios
(from
c.
0.1 to 0.8) than the younger domain II
zircon (Fig. 35a). Their ages are 455, 469 and
482 Ma. Due to their very low U content these
analysis are very poor quality and show very high
errors. This is most probably due to an intense
solid-state Pb-loss process triggered by the HP
post-protolith metamorphism. Therefore their
ages are not considered to establish a protolith
age.
Domain II (
c.
390 Ma) zircon have low U
content (but higher than domain I zircon) and
very lowTh/U ratios (< 0.01; Fig. 35a). They have
lower
176
Lu/
177
Hf ratios (
c.
0.00001; Fig. 35b) and
also lower
176
Yb/
177
Hf ratios (average:
c.
0.0015;
Appx. 4) than domain I zircon.
176
Hf/
177
Hf
(t)
ratios for all analysed zircon grains plot within
error at 0.282821 ± 0.000061 (domain II) and
0.282859 ± 0.000016 (domain I; ±2 SD; Fig.
34b). These very similar
176
Hf/
177
Hf
(t)
ratios
between domain I magmatic zircon and domain
II metamorphic zircon seem to clearly indicate
that domain II zircon was formed by a solid-
state recrystallisation process of domain I zircon.
This is due to the high immobility of Hf in Zrn,
basically because Hf has the same ionic radius
than Zr (155
p
m; Hoskin & Schaltegger, 2003).
The lower amount of Lu and Yb with respect to
Hf and also of Th with respect of U of domain
II zircon in relation to domain I zircon are
explained as a consequence of the intense and
extreme solid-state recrystallisation process. This
process purged from the crystal structure the
cations with ionic radii and chemical properties
(such as oxidation state) significantly different
$
ڙ
$
1R GDWD
$
ڙ
$
ڙ
$
ڙ
1R GDWD
$
ڙ
$
ڙ
$
ڙ
$
$
$
ڙ
ȝP
$
ڙ
$
ڙ
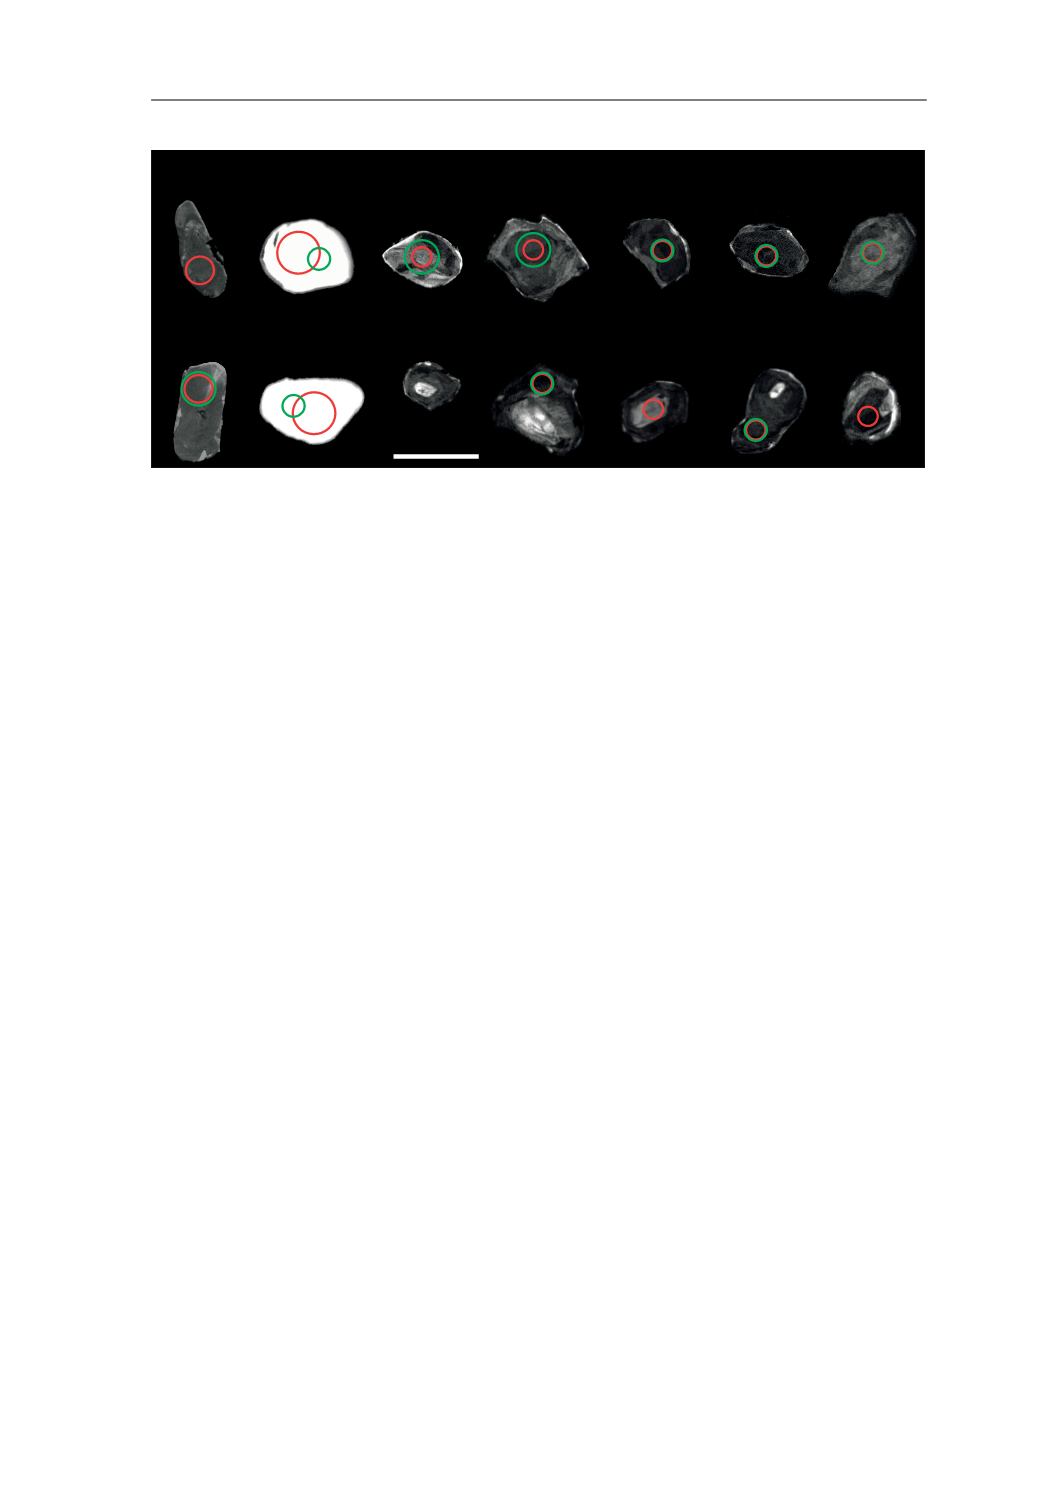
Fig. 33.
CL (cathodoluminescence) images of representative zircons from the studied sample. Laser ablation pits for U–Pb
analyses (red line circles) have 23, 33 and 50
μ
m diameters. Laser ablation pits for Lu–Hf analyses (green line circles) have
26 and 33
μ
m diameters. White numbers are the reference number of the analysis, red numbers are the U–Pb age and its 2
σ
error (Ma) and the green numbers are the
H
Hf values for the U–Pb age.
CL images of A007 and A008 were taken with diffe-
rent SEM parameters than the rest of the Zrn of this sample. Textures of A007 and A008 are the same than A006 and A009.
7.3. ECLOGITES