


 172 / 352

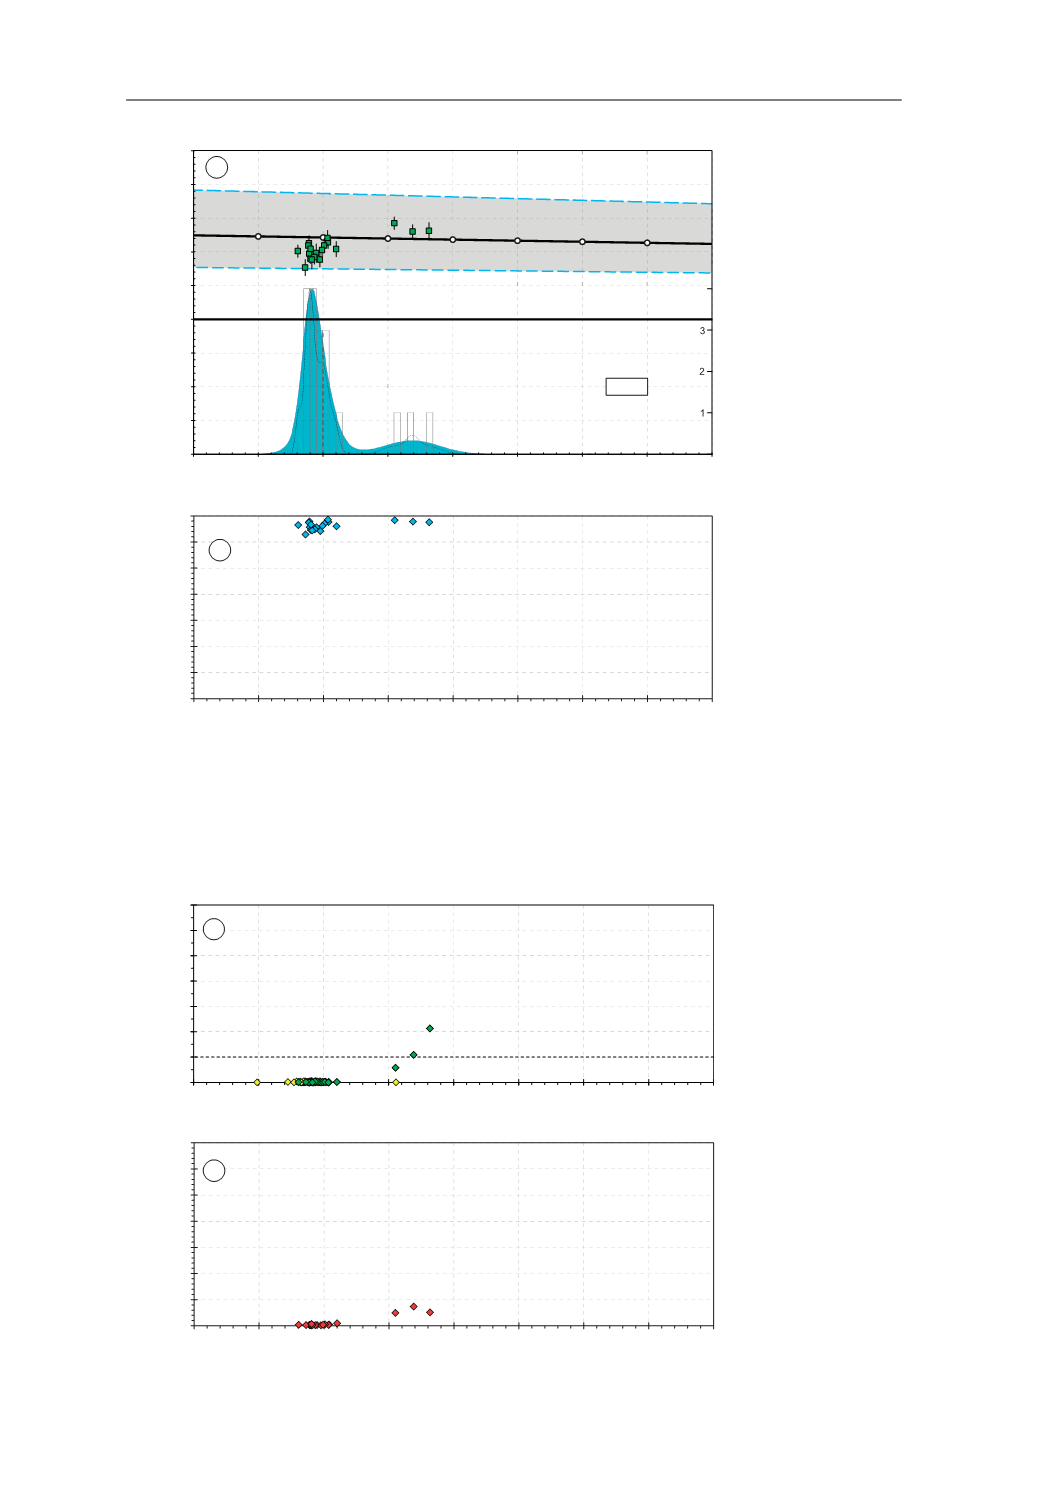
156
Fig. 34. a
H
Hf
v
. age dia-
gram. Error bars are +2
σ
and -2
σ
uncertainties.
n
,
number of concordant
zircon grains analysed for
Lu–Hf isotopes. Numbers
in the right vertical axis
represent histogram fre-
quency. Top-right rectan-
gle shows Nd whole-rock
model-age for the stu-
died sample. MORB
H
Hf
interval was taken from
Chauvel & Blichert-Toft
(2001) considering a mi-
nimum
H
Hf
(t=0Ma)
= +8.3
and a maximum
H
Hf
(t=0Ma)
= +20.7. These values are
propagated to
H
Hf
(t=4Ga)
= 0 defining a grey field
(enclosed by the blue dis-
continuous lines) around
the DM-evolution trend,
to provide an indication
of the likely range of DM
compositions
through
time. MORB: mid-ocean
ridge basalts; DM: deple-
ted mantle; CHUR: chon-
dritic uniform reservoir.
b
176
Hf/
177
Hf
(t)
v
. age dia-
gram.
Fig. 35. a
Th/U ratios
v
. age diagram (yellow
rhombus represent Zrn
analysed
for
U–Th–
Pb isotopes and green
rhombus represent those
analysed for U–Th–Pb
and Lu–Hf isotopes).
b
176
Lu/
177
Hf
(t)
v
. age dia-
gram.
ͲϮϬ
Ͳϭϱ
ͲϭϬ
Ͳϱ
Ϭ
ϱ
ϭϬ
ϭϱ
ϮϬ
Ϯϱ
ϯϬϬ
ϰϬϬ
ϱϬϬ
ϲϬϬ
ϳϬϬ
İ+I
W
ϱϬϬ
ϰϬϬ
ϲϬϬ
&+85
Q
025% '0
Ϭ͘Ϯϴϭϱ
Ϭ͘Ϯϴϭϳ
Ϭ͘Ϯϴϭϵ
Ϭ͘ϮϴϮϭ
Ϭ͘ϮϴϮϯ
Ϭ͘ϮϴϮϱ
Ϭ͘ϮϴϮϳ
Ϭ͘ϮϴϮϵ
ϯϬϬ
ϯϱϬ
ϰϬϬ
ϰϱϬ
ϱϬϬ
ϱϱϬ
ϲϬϬ
ϲϱϬ
ϳϬϬ
D
E
+I +I
W
8 3E DJH >0D@
8 3E DJH >0D@
Ϭ
Ϭ͘ϬϬϬϱ
Ϭ͘ϬϬϭϬ
Ϭ͘ϬϬϭϱ
Ϭ͘ϬϬϮϬ
Ϭ͘ϬϬϮϱ
Ϭ͘ϬϬϯϬ
Ϭ͘ϬϬϯϱ
ϯϬϬ
ϯϱϬ
ϰϬϬ
ϰϱϬ
ϱϬϬ
ϱϱϬ
ϲϬϬ
ϲϱϬ
ϳϬϬ
/X +I
8 3E DJH >0D@
E
8 3E DJH >0D@
ϯϬϬ
ϯϱϬ
ϰϬϬ
ϰϱϬ
ϱϬϬ
ϱϱϬ
ϲϬϬ
ϲϱϬ
ϳϬϬ
Ϭ
Ϭ͘Ϯ
Ϭ͘ϰ
Ϭ͘ϲ
Ϭ͘ϴ
ϭ͘Ϭ
ϭ͘Ϯ
ϭ͘ϰ
7K 8 UDWLR
D
7.3. ECLOGITES